 NERC Data Catalogue Service
UK Location (INSPIRE)
Type of resources
Available actions
Topics
Keywords
Contact for the resource
Provided by
Years
Formats
Representation types
Update frequencies
Service types
Scale
Resolution
-

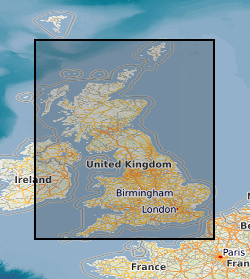
Magnetograms are records of variations in the strength and direction of the Earth’s magnetic field. Historically these magnetograms were recorded on paper using photographic techniques. In the UK, measurements were made at eight long-running observatories; Abinger, Eskdalemuir, Falmouth, Greenwich, Hartland, Kew, Lerwick, and Stonyhurst. BGS also hold magnetogram records from the Cape Evans observatory that ran continuously at Robert Falcon Scott’s Antarctic base camp during the British Antarctic Expedition 1910–13. The magnetogram collection, one of the longest running geomagnetic series in the world, provides a continuous record of more than 160 years of UK measurements. These magnetograms start in the 1840s and end in 1986 at which time digital recording of the magnetic field took over and magnetograms can be produced by computer graphic. The plots show variation in the Earth's magnetic field, typically over a 24-hour period. The collection is a valuable, partly untapped data resource for studying geomagnetic storms, space weather and the evolution of the Earth’s magnetic field. The magnetograms provide insight into: • the Earth’s outer core: long-term change (years to centuries) in the dynamo that sustains our magnetic field • space weather: short-term changes (seconds to days) in near-Earth space and on the ground • space climate: long-term change (decades to centuries) in solar activity and consequences for Earth’s environment All the above have an impact on human activities. For example, bad space weather affects technologies that we increasingly rely on, such as electrical power and GPS networks. In response to the threat of loss from degradation due to age and a desire to preserve and exploit old data, BGS undertook a programme of work to digitally photograph, archive and preserve the analogue paper records of magnetic field variation in the United Kingdom. Between 2009 and 2013, high-quality digital images of every available magnetogram were taken. These images are available to search online. Scientists and the general public around the world can now gain easy access to this historical dataset.
-
The GeoSure data sets and reports from the British Geological Survey provide information about potential ground movement or subsidence in a helpful and user-friendly format. The reports can help inform planning decisions and indicate causes of subsidence. Complete Great Britain national coverage is available. GeoSure Basic is a single, combined GeoSure model, containing only the highest score of all the GeoSure layers. The model has been re-classified to negligible - very low, low and moderate - high. The methodology is based on the 6 GeoSure individual hazard Assessments. The storage formats of the data are ESRI and MapInfo but other formats can be supplied.
-

The GeoSure datasets and related reports from the British Geological Survey provide information about potential ground movement due to six types of natural geological hazard, in a helpful and user-friendly format. The reports can help inform planning decisions and indicate causes of subsidence. The Collapsible Ground dataset provides an assessment of the potential for a geological deposit to collapse (to subside rapidly) as a consequence of a metastable microfabric in loessic material. Such metastable material is prone to collapse when it is loaded (as by construction of a building, for example) and then saturated by water (as by rising groundwater, for example). Collapse may cause damage to overlying property. The methodology is based on BGS DiGMapGB-50 (Digital Map) and expert knowledge of the origin and behaviour of the formations so defined. It provides complete coverage of Great Britain, subject to revision in line with changes in DiGMapGB lithology codes and methodological improvements. The storage formats of the data are ESRI and MapInfo but other formats can be supplied.
-
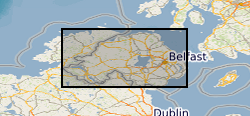
The joint PHE-GSNI-BGS digital Radon Potential Dataset for Northern Ireland provides the current definitive map of radon Affected Areas in Northern Ireland. The Radon Potential map for Northern Ireland shows the estimated percentage of homes in an area exceeding the radon Action Level. This is the basic information to assigning the level of protection required for new buildings and extensions, as described in the Building Research Establishment guidance BR-413 Radon: Guidance on protective measures for new dwellings in Northern Ireland (2004). The Radon Potential map for Northern Ireland is based on PHE indoor radon measurements and 1:10 000 or 1: 250 000 scale digital geology information provided by the Geological Survey of Northern Ireland (GSNI). The indoor radon data is used with the agreement of the Northern Ireland Environment Agency and PHE. Confidentiality of measurement locations is maintained through data management practices. Access to the data is restricted. Radon is a natural radioactive gas, which enters buildings from the ground. Exposure to high concentrations increases the risk of lung cancer. Public Health England (PHE) recommends that radon levels should be reduced in homes where the annual average exceed 200 becquerels per cubic metre (200 Bq m-3), the Action Level. PHE defines radon Affected Areas as those with 1% chance or more of a house having a radon concentration at or above the Action Level. Further information on radon can be obtained from www.ukradon.org
-
Hourly and minute means of the geomagnetic field vector components from observatories around the world from, respectively, 1883 and 1969, to the present day. At present there are about 160 observatories. These data are useful for tracking changes in the magnetic field generated inside and outside the Earth. Data are produced by a number of organisations around the world, including BGS. Data are available in plain text from www.wdc.bgs.ac.uk.
-

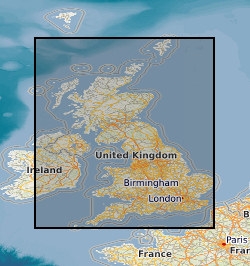
Magnetograms are records of variations in the strength and direction of the Earth’s magnetic field. Historically these magnetograms were recorded on paper using photographic techniques. In the UK, measurements were made at eight long-running observatories; Abinger, Eskdalemuir, Falmouth, Greenwich, Hartland, Kew, Lerwick, and Stonyhurst. BGS also hold magnetogram records from the Cape Evans observatory that ran continuously at Robert Falcon Scott’s Antarctic base camp during the British Antarctic Expedition 1910–13. The magnetogram collection, one of the longest running geomagnetic series in the world, provides a continuous record of more than 160 years of UK measurements. These magnetograms start in the 1840s and end in 1986 at which time digital recording of the magnetic field took over and magnetograms can be produced by computer graphic. The plots show variation in the Earth's magnetic field, typically over a 24-hour period. The collection is a valuable, partly untapped data resource for studying geomagnetic storms, space weather and the evolution of the Earth’s magnetic field. The magnetograms provide insight into: • the Earth’s outer core: long-term change (years to centuries) in the dynamo that sustains our magnetic field • space weather: short-term changes (seconds to days) in near-Earth space and on the ground • space climate: long-term change (decades to centuries) in solar activity and consequences for Earth’s environment All the above have an impact on human activities. For example, bad space weather affects technologies that we increasingly rely on, such as electrical power and GPS networks. In response to the threat of loss from degradation due to age and a desire to preserve and exploit old data, BGS undertook a programme of work to digitally photograph, archive and preserve the analogue paper records of magnetic field variation in the United Kingdom. Between 2009 and 2013, high-quality digital images of every available magnetogram were taken. These images are available to search online. Scientists and the general public around the world can now gain easy access to this historical dataset.
-
This national dataset brings together sixteen national datasets to create a GIS product that provides the information necessary to determine the extent to which the ground is suitable for infiltration sustainable drainage systems (SuDS). It includes derivations of the following datasets: soluble rocks, landslide hazards, groundwater flooding susceptibility, made ground, shallow mining hazards, geological indicators of flooding, depth to water table, superficial thickness, compressible ground, collapsible ground, swelling clays, running sands, predominant flow mechanism, permeability indices and the Environment Agencys source protection zone dataset. All datasets have been reclassified and reattributed (with text descriptions and a score field indicating the suitability of the ground for infiltration) and feature in the end product both as single entities, but also in derived 'screening' maps that combine numerous datasets.
-
The BGS Permeability data product shows estimated rates of water movement from the ground surface to the water table. BGS Permeability version 8 incorporates the latest geology mapping (BGS Geology 50k). This includes updates to the lithology-coding schema, the LEX_RCS. A 2-part code used to identify the named rock unit from the BGS lexicon of named rock units (LEX) followed by a Rock Classification Scheme (RCS) code which describes the rocks lithological characteristics e.g. texture and composition. Updates to these codes and latest dissolution hazard data sourced from BGS GeoSure: Soluble Rocks have been reviewed and classified as part of the version 8 release. The product covers Great Britain and is presented at a scale of 1:50 000, based on the geological data at the same scale. However, in areas where the geology is not mapped to this scale, the next best available scale is used. The BGS Permeability data product can be used to compare the relative permeability of deposits at the regional scale, indicating where highly permeable rocks could allow rapid infiltration to occur, or where less permeable rocks are present and water could pond on the ground surface. The dataset can be used as a component in a wide range of geo-environmental assessments such as natural flood management, Sustainable Drainage Systems, engineering desk studies, slope stability, and aquifer vulnerability. It is for use at the regional scale and is not recommended for use at the site-specific scale.