
annually
Type of resources
Available actions
Topics
Keywords
Contact for the resource
Provided by
Years
Formats
Representation types
Update frequencies
Service types
Scale
Resolution
-
[THIS DATASET HAS BEEN WITHDRAWN]. This dataset contains daily and sub-daily hydrometeorological and soil observations from COSMOS-UK (cosmic-ray soil moisture monitoring network) from the start of the network, in October 2013, to the end of 2016. These data are from 42 sites active across UK during this time, recording a range of hydrometeorological and soil variables. Each site in the network hosts a cosmic-ray sensing probe; a novel sensor technology which can be used, in combination with hydrometeorological data, to calculate the volumetric water content of soil over a field scale. The hydrometeorological and soil data are recorded at a 30 minute resolution and they include neutron counts from the Cosmic-ray sensing probe, humidity and atmospheric pressure data that are used to derive volumetric water content at two temporal resolutions (hourly and daily). Also included are soil heat flux, air temperature, wind speed and net radiation data which are used to derive potential evapotranspiration at a daily resolution. Full details about this dataset can be found at https://doi.org/10.5285/02e54a4e-c421-4222-a08b-3708a00495e3
-
This dataset provides the details of all sites which have been monitored as part of the UK Butterfly Monitoring Scheme (UKBMS). Data includes the location within the UK, the length and width of the line transect on each site, and how long the transect has been monitored. The UKBMS started in 1976 with fewer than 50 sites. The number of sites monitored each year has increased to over a thousand since 2008. There is turnover in sites monitored each year and details of the first and last year in which each site was surveyed are given. The majority of site data is provided by recorders at the time a transect is created. The majority of these recorders are volunteers. The Centre for Ecology & Hydrology (CEH) and Butterfly Conservation (BC) collate the data and the UKBMS is funded by a consortium of organisations led by the Joint Nature Conservation Committee (JNCC). Full details about this dataset can be found at https://doi.org/10.5285/7e4ad816-0b9e-42f2-8b6f-a0e10442a1d3
-
[THIS DATASET HAS BEEN WITHDRAWN]. This dataset contains daily and sub-daily hydrometeorological and soil observations from COSMOS-UK (cosmic-ray soil moisture monitoring network) from the start of the network, in October 2013, to the end of 2015. These data are from 32 sites active across Great Britain during this time, recording a range of hydrometeorological and soil variables. Each site in the network hosts a cosmic-ray sensing probe; a novel sensor technology which can be used, in combination with hydrometeorological data, to calculate the volumetric water content of soil over a field scale. The hydrometeorological and soil data are recorded at a 30 minute resolution and they include neutron counts from the Cosmic-ray sensing probe, humidity and atmospheric pressure data that are used to derive volumetric water content at two temporal resolutions (hourly and daily). Also included are soil heat flux, air temperature, wind speed and net radiation data which are used to derive potential evapotranspiration at a daily resolution. Full details about this dataset can be found at https://doi.org/10.5285/cdcf6ec3-1949-4fe7-a6f2-33c7403eafa1
-
Collated indices are a relative measure of butterfly abundance across monitored sites in the UK, calculated from data collected by the UK Butterfly Monitoring Scheme (UKBMS). Collated indices are calculated annually for each individual butterfly species that has been recorded on five or more sites in that year. Based on this criterion collated indices have been calculated for the entire UKBMS time series from 1976 to the current year for the majority of species. For some rarer species the time series starts in a later year due to lack of data. Collated indices are calculated using a statistical model that accounts for missing data. The number of sites for each species ranges from 5 to several hundred and varies from year to year. Since 2008 more than 1,000 sites have been monitored across the UK each year. Collated indices are calculated so that we can determine how butterfly populations are changing over time across the UK. This data can be used, for example, to determine where to target conservation efforts and to measure the condition of the UK countryside. Butterflies are recognised as important indicators of biodiversity and environmental change (e.g. as official UK Biodiversity Indicators), and have been used in numerous research studies to understand the impacts of changes in climate and the extent and condition of habitats. Although the UK Centre for Ecology & Hydrology (UKCEH) and Butterfly Conservation (BC) are responsible for the calculation and interpretation of the Collated indices, the collection of the data used in their creation is ultimately reliant on a large volunteer community. The UKBMS is funded by a consortium of organisations led by the Joint Nature Conservation Committee (JNCC). This dataset is updated annually and more recent versions of the UKBMS collated indices are available. Full details about this dataset can be found at https://doi.org/10.5285/31f301f5-5374-45c5-8db5-37ea43422b8d
-
Collated indices are a relative measure of butterfly abundance across monitored sites in the UK, calculated from data collected by the UK Butterfly Monitoring Scheme (UKBMS). Collated indices are calculated annually for each individual butterfly species that has been recorded on five or more sites in that year. Based on this criterion collated indices have been calculated for the entire UKBMS time series from 1976 to the current year for the majority of species. For some rarer species the time series starts in a later year due to lack of data. Collated indices are calculated using a statistical model that accounts for missing data. The number of sites for each species ranges from 5 to several hundred and varies from year to year. Since 2008 more than 1,000 sites have been monitored across the UK each year. Collated indices are calculated so that we can determine how butterfly populations are changing over time across the UK. This data can be used, for example, to determine where to target conservation efforts and to measure the condition of the UK countryside. Butterflies are recognised as important indicators of biodiversity and environmental change (e.g. as official UK Biodiversity Indicators), and have been used in numerous research studies to understand the impacts of changes in climate and the extent and condition of habitats. Although the UK Centre for Ecology & Hydrology (UKCEH) and Butterfly Conservation (BC) are responsible for the calculation and interpretation of the Collated indices, the collection of the data used in their creation is ultimately reliant on a large volunteer community. The UKBMS is funded by a consortium of organisations led by the Joint Nature Conservation Committee (JNCC). This dataset is updated annually and more recent versions of the UKBMS collated indices are available. Full details about this dataset can be found at https://doi.org/10.5285/560b320e-7859-449a-b565-f80e369ceb0a
-
Discharge data and in-stream temperature for a peatland headwater stream of the Conwy catchment, North Wales are presented from March 2008 until July 2011. The stream for which the data represents is the Nant y Brwyn situated on the Migneint blanket bog within Snowdonia National Park. The purpose of the data is to calculate annual run-off estimates for the Nant y Brwyn catchment and to provide support for estimating fluvial carbon fluxes. Note: there are gaps in this data set due to equipment/battery failures and/or freezing of the stream. Note dates added to dataset name on 22/06/2017 Full details about this dataset can be found at https://doi.org/10.5285/cd7db09f-edf6-4b06-b878-f1be6c649e3a
-
This dataset consists of plant species presence and abundance in different sizes of plots recorded from the first 100 1km squares across Great Britain in 2019, as part of a rolling soil and vegetation monitoring program of 500 1km squares, repeated every 5 years. The UKCEH Countryside Survey is a unique study or 'audit' of the natural resources of the UK's countryside. The sample sites are chosen from a stratified random sample, based on a 15 by 15 km grid of GB. Surveys have been carried out in 1978, 1984, 1990, 1998 and 2007 by the UK Centre for Ecology & Hydrology (UKCEH) and predecessors, with repeated visits to the majority of squares. The countryside is sampled and surveyed using rigorous scientific methods, allowing us to compare new results with those from previous surveys. In this way, we can detect the gradual and subtle changes that occur in the UK's countryside over time. In addition to vegetation data, soil data are also gathered by the current phase of the Countryside Survey. This work was supported by the Natural Environment Research Council award number NE/R016429/1 as part of the UK-SCAPE programme delivering National Capability. Full details about this dataset can be found at https://doi.org/10.5285/fd6ae272-aeb5-4573-8e8a-7ccfae64f506
-
This dataset provides linear trends, over varying time periods, for the UK Butterfly Monitoring Scheme (UKBMS) Collated Indices of individual butterfly species across the UK. The main statistical values derived from a linear regression (slope, standard error, P-value) are presented for the entire time series for each species (1976 to 2011), for the last 20 years, and for the last decade. In addition a trend class, based on slope direction and its significance, and a percentage change for that time period are provided to describe the statistical trends. These trend data are provided for 59 UK butterfly species. Trends across different time series allow us to determine the long and short-term trends for individual species. This is enables us to focus conservation and research and also to assess species responses to conservation already in place. The Centre for Ecology & Hydrology (CEH) and Butterfly Conservation (BC) are responsible for the calculation and interpretation of this trend datasets. The collection of the underlying UKBMS data is reliant on a large volunteer community. The UK Butterfly Monitoring Scheme is funded by a consortium of organisations led by the Joint Nature Conservation Committee (JNCC). This dataset is updated annually and a more recent version of the UKBMS species trends (2012) is now available. Full details about this dataset can be found at https://doi.org/10.5285/cad2af6c-0c97-414c-8d5f-992741b283cf
-
In 2011 the British Geological Survey (BGS) decided to begin the assembly of a National Geological Model (NGM) from its existing and on-going geological framework models , comprising integrated national crustal, bedrock and Quaternary models. The bedrock component is the most advanced of these themes and comprises both the calculated models and a complementary network of cross-sections that provide a fence diagram for the bedrock geology of Great Britain. This fence diagram, the GB3D_v2012 dataset is available in a variety of formats from the BGS website www.bgs.ac.uk as free downloads. It complements the existing 1:625 000 scale mapsheets published by BGS utilising the same colour schema and geological classification. The 121 component cross-sections extend to depths between 1.5 and 6 km; they have an aggregate length of over 20,000 km, and they are snapped together at their intersections to ensure total consistency. The sections are based on the existing BGS geological framework models where they cut through them, they also take account of the vast wealth of published data on the subsurface structure of Britain both from BGS and in the literature. Much of this is in the form of cross-sections, contour maps of surfaces, and thicknesses (isopachs). The fence diagram has been built in the Geological Surveying and Investigation in 3D (GSI3D) software. It is envisaged that this dataset will form a useful educational resource for geoscience students and the general public, and also provide the bedrock geology context and structure for regional and catchment scale studies. The fence diagram was built in 2009-12 using funding from the BGS National Capability Programme and the Environment Agency of England and Wales. 14 expert regional geologists compiled the sections.
-
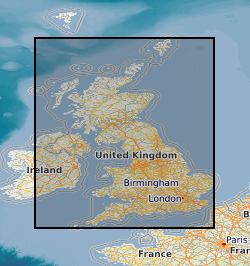
1 km gridded estimates of daily and monthly rainfall for Great-Britain and Northern Ireland (together with approximately 3000 km2 of catchment in the Republic of Ireland) from 1890 to 2019. The rainfall estimates are derived from the Met Office national database of observed precipitation. To derive the estimates, monthly and daily (when complete month available) precipitation totals from the UK rain gauge network are used. The natural neighbour interpolation methodology, including a normalisation step based on average annual rainfall, was used to generate the daily and monthly estimates. The estimated rainfall on a given day refers to the rainfall amount precipitated in 24 hours between 9am on that day until 9am on the following day. The CEH-GEAR dataset has been developed according to the guidance provided in BS 7843-4:2012. Full details about this dataset can be found at https://doi.org/10.5285/dbf13dd5-90cd-457a-a986-f2f9dd97e93c