
10560
Type of resources
Topics
Keywords
Contact for the resource
Provided by
Years
Formats
Representation types
Update frequencies
Scale
-

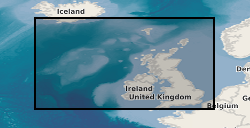
A collection of 1:63 360 and 1:10 560 geological maps of Ireland. The maps were firstly created by the Geological Survey of the United Kingdom and Ireland up until 1905 when the Geological Survey of Ireland was transferred to the Department of Agriculture and Technical Instruction for Ireland. Following this point, the maps were created and published by the Geological Survey of Great Britain (later to become the British Geological Survey). The maps range from 1853 to 1953. Geological maps represent a geologist's compiled interpretation of the geology of an area. A geologist will consider the data available at the time, including measurements and observations collected during field campaigns, as well as their knowledge of geological processes and the geological context to create a model of the geology of an area. This model is then fitted to a topographic base map and drawn up at the appropriate scale, with generalization if necessary, to create a geological map, which is a representation of the geological model. Explanatory notes and vertical and horizontal cross-sections may be published with the map. Geological maps may be created to show various aspects of the geology, or themes. These maps are hard-copy paper records stored in the National Geoscience Data Centre (NGDC) and are delivered as digital scans through the BGS website.
-

These maps are based on the Ordnance Survey quarter-inch to the mile series of maps, for England / Wales and Scotland. Most maps in this series show solid geology only, but there are a few drift maps within the New Series maps of England / Wales. There are three distinct series of quarter-inch maps: - Geological map of England and Wales. Quarter-inch series 1:253 440: Old Series (1889 - 1906). This is a set of hand-coloured maps which were published between 1889 and 1895 with later revisions. They were engraved onto copper. The series was issued as 15 sheets, where sheet 3 was an index to colours. - Geological map of England and Wales. Quarter-inch series 1:253 440: New Series (1906-1977). Following the popularity of the Old Series 'Quarter-inch' map, a New Series of colour-printed maps was issued. This was a long-lived series, with sheets still being published in the late 1970s. Maps were published between 1906–1977. The series was issued as 15 sheets, where sheet 3 was an index to colours. - Geological Survey of Scotland. Quarter-inch series 1:253 440 (1904-1977). These Scottish maps were published in parallel with the English / Welsh New Series, and was issued as 17 sheets. The quarter-inch mapping was superseded in the 1970s - 1980s by the Universal Transverse Mercator (UTM) Series geological maps of the UK and Continental Shelf. Geological maps represent a geologist's compiled interpretation of the geology of an area. A geologist will consider the data available at the time, including measurements and observations collected during field campaigns, as well as their knowledge of geological processes and the geological context to create a model of the geology of an area. This model is then fitted to a topographic basemap and drawn up at the appropriate scale, with generalization if necessary, to create a geological map, which is a representation of the geological model. Explanatory notes and vertical and horizontal cross sections may be published with the map. Geological maps may be created to show various aspects of the geology, or themes. The most common map themes held by BGS are solid (later referred to as bedrock) and drift (later referred to as superficial). These maps are hard-copy paper records stored in the National Geoscience Data Centre (NGDC) and are delivered as digital scans through the BGS website.
-

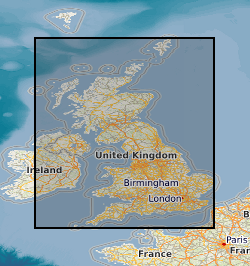
The BGS database of geological maps is an index into BGS holdings of modern and historical published geological maps, geological standards and field slips, and also contains a range of other map series, including geophysical maps, geochemical maps, hydrogeological maps, thematic maps and other small-scale miscellaneous non-series maps. Historical vertical and horizontal sections, as well as indices to colours, are also included. The database comprises map metadata, including the title, theme, survey and revision years, publication years, mapped geological theme, base material, map function, colouration, approval status and the spatial extent of each map sheet. An accompanying file store contains high-resolution JPEG2000 scans for delivery, as well as various digital master and delivery formats. For a small number of maps, no scan exists. In total, the database contains over 240,000 scans of over 130,000 maps and field slips. The majority of the maps in the database cover Great Britain, but other regions are also represented, including a historical series of 1-inch maps of Ireland, 6-inch maps of the Isle of Man, 1:25 000 scale maps of the Channel Islands, and various overseas maps. The database contains a record of all geological maps produced by the British Geological Survey and its predecessors since the commencement of systematic geological mapping in the 1830s. The BGS Maps Database is mostly an archive of previous BGS maps, and is not the same as the latest BGS digital mapping. The maps within the database may differ significantly from BGS digital vector mapping. Further information about BGS digital vector mapping is available on the BGS website, under 'BGS Datasets'. The database has evolved over time, originally being a series of discrete databases. These databases have now been aggregated into a single dataset. BGS published maps, as well as 1:10 560 and 1:10 000 large-scale geological maps of England and Wales, and Scotland, are available through the BGS Maps Portal. Field slips and some thematic maps are not included on the BGS Maps Portal. The information about a map is normally a transcription from the map itself. Sometimes key information such as the title may not be actually printed on the map. Where this is the case the information is supplied in square brackets, e.g. [Kirk Maiden]. Information in square brackets means the information is supplied by the cataloguer and is not transcribed from the item.
-
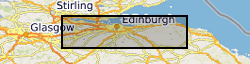
A collection of seventy-eight maps covering thirteen National Grid 1:10 560 map sheets in the area of the Lothian oil shale field published between 1977 and 1982. Each map shows the extent of a single oil shale seam. An oil shale seam refers to a layer or deposit of sedimentary rock rich in organic material known as kerogen, which has the potential to yield hydrocarbons such as oil and gas through a process called pyrolysis. Oil shale is different from conventional oil and gas reservoirs in that the hydrocarbons are not present in a liquid or gaseous form but are trapped within the solid structure of the shale rock. The maps were published by the Institute of the Geological Sciences in Edinburgh (previous name for the British Geological Survey). This entry relates to hardcopy maps stored in the National Geological Data Centre (NGDC) and digital files produced by scanning them, as well as any derivative files. These maps are hard-copy paper records stored in the National Geoscience Data Centre (NGDC).
-
This dataset shows the geographic extents of Mineral Assessment Reports covering sand and gravel resources and selected other industrial minerals across the United Kingdom. The index polygons represent the areas surveyed, typically between 100 and 200 square kilometres, for which individual reports and accompanying 1:25 000 scale maps were produced. The sand and gravel resources of the UK were surveyed on a regional basis by the Industrial Minerals Assessment Unit (IMAU) between 1968 and 1990. Each survey area was investigated through drilling and sampling of sand and gravel deposits, borehole logging, and particle-size analysis to determine the proportion of gravel, sand and fines. The accompanying maps categorise resources as exposed, present beneath overburden, or potentially not workable. In addition to sand and gravel, other industrial mineral resources were assessed during the same period, including celestite, limestone and dolomite, conglomerate, and hard rock resources. Selecting individual polygons provides details of the corresponding report, including title, report number, author(s), subtitle and publication date. The Mineral Assessment Report series was commissioned by the Department of the Environment and undertaken by the British Geological Survey.
-

The BGS collection of 1:10 560 / 1:10 000 National Grid Series geological maps. These maps are based on the Ordnance Survey National Grid series of maps, which are defined by the 10 km intervals of the larger 100 km square identified by a specific two-letter code. Each map is thus denoted by a unique reference, e.g. SP 29 NW. SP=100 km square; 29=10 km square; NW=5 km square. Since field mapping is generally undertaken at the scale of 1:10 000 (or equivalent), these maps are the largest-scale main series of geological maps that BGS holds. A small number of remote areas were mapped at 1:25 000 scale, the subsequent maps are also at 1:25 000 scale and are included in this series. The equivalent to the National Grid Series prior to the 1960s is the County Series (at 1:10 560 scale). In the 1960s, this series started to be replaced by 6 inches to 1 mile (1:10 560 scale) National Grid sheets based on the four quadrants (NW, NE, SW, SE) of a 10 km Ordnance Survey National Grid square. Areal coverage provided by the National Grid series of large-scale maps is limited in extent and the preceding County series of six-inch maps can still be the most up to date map available for some areas. Geological maps represent a geologist's compiled interpretation of the geology of an area. A geologist will consider the data available at the time, including measurements and observations collected during field campaigns, as well as their knowledge of geological processes and the geological context to create a model of the geology of an area. This model is then fitted to a topographic basemap and drawn up at the appropriate scale, with generalization if necessary, to create a geological map, which is a representation of the geological model. Explanatory notes and vertical and horizontal cross sections may be published with the map. Geological maps may be created to show various aspects of the geology, or themes. The most common map themes held by BGS are solid (later referred to as bedrock) and drift (later referred to as superficial). These maps are, for the most part, hard-copy paper records stored in the National Geoscience Data Centre (NGDC) and are delivered as digital scans through the BGS website.
-

For much of the Geological Survey's existence, the County Series of maps were the standard large-scale maps on which geological mapping was undertaken. These maps are based on the Ordnance Survey County (or six-inch to the mile) series of maps. These maps were cut up to be used in the field to record geological observations, and on return to the office, the geology was transferred to a complete County Series map, which after approval was known as a 'standard' (England / Wales) or 'clean copy' (Scotland). This dataset contains the 'standard' or 'clean copy' County Series maps held by BGS. Geological maps represent a geologist's compiled interpretation of the geology of an area. A geologist will consider the data available at the time, including measurements and observations collected during field campaigns, as well as their knowledge of geological processes and the geological context to create a model of the geology of an area. This model is then fitted to a topographic basemap and drawn up at the appropriate scale, with generalization if necessary, to create a geological map, which is a representation of the geological model. Explanatory notes and vertical and horizontal cross sections may be published with the map. Geological maps may be created to show various aspects of the geology, or themes. The most common map themes held by BGS are solid (later referred to as bedrock) and drift (later referred to as superficial). These maps are hard-copy paper records stored in the National Geoscience Data Centre (NGDC) and are delivered as digital scans through the BGS website.
-
This layer of the map based index (GeoIndex) shows the location, with basic metadata, of selected DECC (Department of Energy & Climate Change) offshore hydrocarbon wells. The source data for this layer was downloaded from the DECC website at www.og.decc.gov.uk/information/maps_offshore.htm. These are DECC owned data and information and supply of the actual data is through the DECC release agents.