
100000
Type of resources
Available actions
Topics
Keywords
Contact for the resource
Provided by
Years
Formats
Representation types
Update frequencies
Scale
Resolution
-

A digital elevation model of the base of the Holocene for the Mersey estuary. The model was created as part of the Estuaries Research Programme (EMPHASYS).
-
This dataset for the UK, Jersey and Guernsey contains the Corine Land Cover (CLC) changes between 2006 and 2012. This shapefile has been created by combining the land cover change layers from the individual CLC database files for the UK, Jersey and Guernsey. CLC is a dataset produced within the frame of the Initial Operations of the Copernicus programme (the European Earth monitoring programme previously known as GMES) on land monitoring. CLC provides consistent information on land cover and land cover changes across Europe. This inventory was initiated in 1985 (initial reference year 1990) and then established a time series of land cover information with updates in 2000 and 2006 with the last one being for the 2012 reference year. CLC products are based on the analysis of satellite images by national teams of participating countries - the EEA member and cooperating countries - following a standard methodology and nomenclature with the following base parameters: - 44 classes in the hierarchical three level Corine nomenclature - Minimum mapping unit (MMU) for Land Cover Changes (LCC) for the change layers is 5 hectares. The resulting national land cover inventories are further integrated into a seamless land cover map of Europe. Land cover and land use (LCLU) information is important not only for land change research, but also more broadly for the monitoring of environmental change, policy support, the creation of environmental indicators and reporting. CLC datasets provide important information supporting the implementation of key priority areas of the Environment Action Programmes of the European Union as protecting ecosystems, halting the loss of biological diversity, tracking the impacts of climate change, assessing developments in agriculture and implementing the EU Water Framework Directive, among others. Full details about this dataset can be found at https://doi.org/10.5285/35fecd0f-b466-448b-94d1-0bba90be450e
-

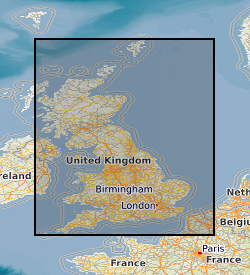
A collection of small-scale non-series maps which offer whole-country coverage of the United Kingdom 1856-2013. Included in the collection are geological, tectonic, structural, mineral resource and geophysical maps, together with a small number of historical facsimile maps. Key geological maps included in the collection which ran to many editions are Geology of the British Islands 1:584 000 and the Geological Map of Great Britain 1:625 000. These maps are hard-copy paper records stored in the National Geoscience Data Centre (NGDC) and are delivered as digital scans through the BGS website.
-

Names and boundaries of historic counties, also known as ancient or geographical counties, stored in Oracle spatial database, published by the Historic County Borders project which is managed by the Historic Counties Trust
-

This layer of the GeoIndex shows the localities for which details of identified fossil specimens in the BGS Biostratigraphy Museum are databased. Only Ordovician and Silurian specimens listed currently. Samples and taxonomic identifications will be listed and will in future be able to be queried using the query-by-attribute tool to the right of the map. See also Fossil Localities. Material is available for inspection on application by e-mail; it is free for academic research but is charged for commercial work. Specimens are sometimes available for loan to bona fide academics.
-
The National Soil Parent Material dataset is a GIS describing the geological material from which topsoils and subsoils (A and B horizons) develop (i.e. from the base of pedological soil down to c. 3m). These deposits display a variable degree of weathering, but still exhibit core geological characteristics relating to their lithologies. The dataset covers England, Scotland and Wales and characterises parent material lithology, texture, mineralogy, strength and a range of other soil/parent related properties.
-

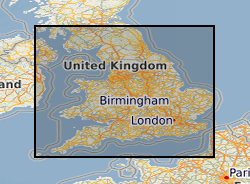
The 1:63 360 / 1:50 000 scale map series are the most useful scale for most purposes. They provide almost complete coverage of onshore Great Britain. The BGS collection of 1:63 360 and 1:50 000 scale maps comprises two map series: - Geological Survey of England and Wales 1:63 360 / 1:50 000 Geological Map Series [New Series]. These maps are based on the Ordnance Survey One-inch New Series topographic basemaps and provide almost complete coverage of England and Wales, with the exception of sheet 180 (Knighton). The quarter-sheets of 1:63 360 Old Series sheets 91 to 110 coincide with sheets 1 to 73 of the New Series maps. These earlier maps often carry two sheet numbers which refer to the Old Series and the New Series. - Geological Survey of Scotland 1:63 360 / 1:50 000 Geological Map Series. These maps are based on the Ordnance Survey First, Second, Third and Fourth editions of the One-inch map of Scotland. The maps used the most recent topographic basemap available at the time. In the Western Isles, one-inch mapping was abandoned and replaced by maps at 1:100 000 scale, which are associated with this series. Sheets were traditionally issued at 1:63 360 scale, with the first 1:50 000 maps appearing in 1972. Sheets at 1:50 000 scale may be either facsimile enlargements of an existing 1:63 360 sheets, or may contain new geology and cartography. The latter bear the additional series designation '1:50 000 series'. Within the Scottish series, new mapping at 1:50 000 scale was split into east and west sheets. For example, the original one-inch sheet 32 became 1:50 000 sheets 32E and 32W. A number of irregular sheets were also introduced with the new 1:50 000 scale mapping. There are a number of irregular special sheets within both series. Geological maps represent a geologist's compiled interpretation of the geology of an area. A geologist will consider the data available at the time, including measurements and observations collected during field campaigns, as well as their knowledge of geological processes and the geological context to create a model of the geology of an area. This model is then fitted to a topographic basemap and drawn up at the appropriate scale, with generalization if necessary, to create a geological map, which is a representation of the geological model. Explanatory notes and vertical and horizontal cross sections may be published with the map. Geological maps may be created to show various aspects of the geology, or themes. The most common map themes held by BGS are solid (later referred to as bedrock) and drift (later referred to as superficial). These maps are, for the most part, hard-copy paper records stored in the National Geoscience Data Centre (NGDC) and are delivered as digital scans through the BGS website.
-
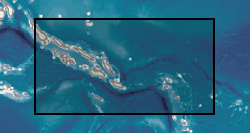
Two geochemical surveys were undertaken in the Solomon Islands between 1976 and 1983 as part of a combined geological mapping and mineral exploration project. The survey of Choiseul and the Shortland Islands was carried out between 1976 and 1979 by the Institute of Geological Sciences (now the British Geological Survey) with support from staff of the Geology Division of the Ministry of Land, Energy and Natural Resources, Solomon Islands. The project produced 12 geological maps at 1:50,000 scale as well as a series of unpublished reports. The survey of the New Georgia Group of islands was undertaken between 1979 and 1983. The project produced 7 geological maps at a scale of 1:100,000 and a regional map of the entire island group at a scale of 1:250,000. A series of multielement geochemical anomaly maps were produced at a scale of 1:100,000 to accompany each of the published geological maps. Master copies of these are held at the Geological Survey in Honiara. Full descriptions of the methods used are described in the margins of the anomaly maps. A total of 8848 stream sediment samples were collected from Choiseul and 7441 from the New Georgia Group, resulting in an average sampling density for the two areas of 2.68 samples per km2 and 1.47 samples per km2 respectively. Sampling in the Shortland Islands was confined to the larger islands, 187 were collected from the Fauro Island group, 148 from Alu and 69 from Mono. The samples were dry sieved and the fraction passing -80 mesh B.S. (177 microns) was analysed. A hot concentrated nitric acid digestion was used prior to analysis by atomic absorbtion spectrophotometry (AAS) for Co, Cu, Pb, Zn, Ni, Ag, and Mn. Samples from the vicinity of the Siruka Ultramafic Complex were determined for Cr by AAS after digestion by a bisulphate fusion technique. Raw data can be obtained from the Geology Division, Ministry of Mines and Energy, PO Box G37, Honiara, Solomon Islands.
-
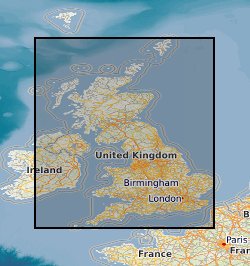
Digitised versions of a set of 1:100,000 scale maps of aquifer vulnerability for England and Wales. The dataset identifies the vulnerability to pollution of major and minor aquifers as defined by the Environment Agency, utilising a combination of geological, hydrogeological and soils data. The maps are designed to be used by planners, developers, consultants and regulatory bodies to ensure that developments conform to the Policy and Practice of the Environment Agency for the protection of Groundwater. Please note that these maps are based on data from the late 1980's and early 1990's, more up-to-date digital data may now be available from the Environment Agency. Flat maps may be purchased from the BGS, some sheets are now out of print.
-
The map shows the localities of significant fossil samples, either collected by BGS Staff, or donated by individuals and institutions. The BGS fossil collections contain over 2 million specimens, including a sizeable quantity of type, figured and cited material. Since a small number of fossil locations are confidential, you are unable to view this dataset at large scales. However, if you send a data enquiry, such information may be made available. Enquiries are normally free, but a charge may be levied depending upon the time taken; users will be notified in advance. Material is available for inspection on application by e-mail. Specimens are sometimes available for loan to bona fide academics.