
250000
Type of resources
Available actions
Topics
Keywords
Contact for the resource
Provided by
Years
Formats
Representation types
Update frequencies
Scale
-
The data comprises information on the subsurface structure of stratigraphic levels and units in the United Kingdom, detailing depth to and thickness of the units. These result from projects in different parts of the UK performed at different times. Common working scales are 1:50 000 and 1:250 000 with appropriate differences in detail. Much mapping results from interpretation of seismic data, and as a result many of the structural maps are in time rather than depth, although some have been depth converted.
-

The data is a simplified version of DiGMap for use on the web and for smart applications such as iGeology. Sourced from 1:50000 DiGMapGB-50 Version 6 where available.The attributes therefore include both superficial and bedrock plus their source. The geology is fitted to a relevant topographic base at the time of production. Near full Great Britain coverage is available. The data is available in vector format. BGS licensing terms and conditions apply to external use of the data.
-

This map is part of the open-loop ground source heat pump screening tool and shows where suitable subsurface conditions exist in England and Wales for open loop GSHP installations of >100kW heating/cooling output .
-
The Quaternary deposits thickness dataset is a digital geological map across the bulk of the UK Continental Shelf (UKCS), for areas up to a water depth of 200m, which shows the thickness of the deposits over bedrock in three categories: <5 m, 5 - 50 m, and >50 m Quaternary cover. These depth bands were picked because they represent the horizons that have impact on offshore infrastructure deployment. The map is derived from (unpublished) BGS 1:1000000 scale Quaternary digital geological mapping. The map was produced in 2014 in collaboration with, and co-funded by, The Crown Estate as part of a wider commissioned project to assess seabed geological constraints on engineering infrastructure across the UKCS. The data are held by the BGS as an ESRI Shapefile.
-

The UTM series of maps are based on 1:250 000 base maps published by the Ordnance Survey. Mapping is divided into squares which cover 1 degree by 1 degree of latitude / longitude in the Universal Transverse Mercator (UTM) projection, and coverage extends offshore and onto the continental shelf. The UTM series are available in three different themes: - Solid geology (complete coverage within the mapped area, including most of the UK continental shelf) - Sea bed sediments (coverage for most offshore areas) - Quaternary geology (coverage for the UK sector of the North Sea, Irish Sea and the Atlantic margin) Also included within this series are two small-scale (1:500 000) bedrock geology maps of the Central Rockall Basin and North Rockall Basin. These maps supersede the older quarter-inch series of maps which were published for England / Wales and Scotland. Geological maps represent a geologist's compiled interpretation of the geology of an area. A geologist will consider the data available at the time, including measurements and observations collected during field campaigns, as well as their knowledge of geological processes and the geological context to create a model of the geology of an area. This model is then fitted to a topographic basemap and drawn up at the appropriate scale, with generalization if necessary, to create a geological map, which is a representation of the geological model. Explanatory notes and vertical and horizontal cross sections may be published with the map. These maps are, for the most part, hard-copy paper records stored in the National Geoscience Data Centre (NGDC) and are delivered as digital scans through the BGS website.
-
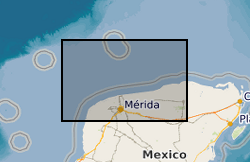
BIRPS (the British Institutions Reflection Profiling Syndicate) acquired almost 650 km of offshore seismic data and 300 km of onshore seismic data over the Chicxulub impact crater. The data were recorded to 18 s two-way time.
-
This layer of the map based index (GeoIndex) shows the locations of over 12,500 rock samples from the land area of the United Kingdom gathered as part of the Mineral Reconnaissance Programme (MRP). The Mineral Reconnaissance Programme (MRP), funded by the DTI, carried out baseline mineral exploration in Great Britain between 1972 and 1997. The programme has been subsumed into the new BGS Minerals Programme, also funded by the DTI. The rock samples have been analysed for a variety of major and trace elements, mainly by XRF.
-

This dataset is now superseded by Marine bedrock dataset (DiGRock250k) version 3. The BedRock data shows polygonal and selected linear geological information, sourced from published BGS 1:250 000 scale maps. Geological units are identified using BGS LEX-ROCK nomenclature that may differ from that on the printed maps. UK waters coverage is available with additional information from surrounding nations. The data is available in vector format. BGS licensing terms and conditions apply to external use of the data.
-
THIS DATASET HAS BEEN WITHDRAWN **This dataset was created for the "Britain beneath our feet" atlas using information extracted from the Geochemical Baseline Survey Of The Environment (G-BASE) For The UK . For Arsenic in soil data please see Geochemical Baseline Survey Of The Environment (G-BASE) For The UK ** Geochemical Baseline Survey Of The Environment (G-BASE) coverage for arsenic in soil. The G-BASE programme involves systematic sampling and the determination of chemical elements in samples of stream sediment, stream water and, locally, soil, to build up a picture of the surface chemistry of the UK. The average sample density for stream sediments and water is about one site per 1.5-2km square. Analytical precision is high with strict quality control to ensure countrywide consistency. Results have been standardised to ensure seamless joins between geochemical sampling campaigns. The data provide baseline information on the natural abundances of elements, against which anomalous values due to such factors as mineralisation and industrial contamination may be compared. Published in Britain beneath our feet atlas.
-

Data identifying linear features representing geological faults at the ground or bedrock surface (beneath superficial deposits). The scale of the data is 1:250 000, providing a generalised set of linear features. Onshore coverage is provided for all of England, Wales, Scotland, and the Isle of Man. Geological faults occur where a body of bedrock has been fractured and displaced by large scale processes affecting the Earth's crust (tectonic forces). The digital data are attributed by fault type; two categories of fault are described in the data: contact and non-contact faults. Contact faults form a boundary between two different rock types whilst non-contact faults indicate a fault displacement within the same rock. The data have been generalised and show only the location of major faults. All faults shown are inferred (i.e. not exposed or seen at a locality), but derived from other evidence including linear depressions in the landscape, the truncation or displacement of topographical features. The data are available in vector format (containing the geometry of each feature linked to a database record describing their attributes) as ESRI Shapefiles and are available under BGS data licence.