
Maps
Type of resources
Available actions
Topics
Keywords
Contact for the resource
Provided by
Years
Formats
Representation types
Update frequencies
Service types
Scale
-
The Quantifying Flood Risk of Extreme Events using Density Forecasts Based on a New Digital Archive and Weather Ensemble Predictions Project is a Natural Environment Research Council (NERC) Flood Risk for Extreme Events (FREE) Research Programme project (Round 1 - NE/E002013/1 - Duration January 2007 - December 2008) led by Dr Patrick McSharry, University of Oxford. The dataset contains a collection of rainfall depth maxima data, dating back to 1860, plus associated description documents and rainfall maps of extreme events across the UK, have been used. All of these products have been digitised from the paper version of the British Rainfall publication, and are now archived at the BADC to enable easy access for future use and the wider community. Floods in the UK are often caused by heavy rainfall lasting from minutes to weeks. Efficient management and mitigation of flood risk, especially surface water flooding in urban areas, requires accurate and reliable precipitation forecasts as inputs to flood risk models. Houses in flat areas are particularly at risk and meeting the shortage of houses in the south-east requires building on these areas. To estimate the flood hazard risk in order to try to protect these buildings, accurate rainfall predictions are needed. However, the connection between record rainfall and flooding is highly nonlinear, so that rainfall predictions must also say how likely rainfall is at any time - calculating the probability of rainfall. Extreme rainfalls caused devastating floods in Boscastle in 2004 and Lynmouth in 1952, but the causes and pattern of rainfall was different. Therefore, scientists also need to know what pattern of rainfall caused the flooding. This research aims to get good quality predictions of the probability of rainfall by combining advanced methods from statistics, the output from a new supercomputer model of the weather, and a new computer archive of exteme rainfalls going back to 1866 (and up to 1968), provided by a specialist company Hydro-GIS Ltd. It also aims to produce an automatic system for discovering the most likely pattern in the predicted rainfalls. The new prediction system and data will be freely available over the internet for use by the government and universities.
-
These are the results obtained from an empirical test looking at the communicative effectiveness between two types of two dimensional (2D) map formats (Choropleth maps, and Cartograms) of the Greater London area of the United Kingdom. Participants were interviewed and observed individually during the procedure. The results contain the recorded measurements of spatial accuracy, and the time taken for each participant to answers 3 test questions. A post-test qualitative reaction of each participants' preference between the two map types is recorded, along with their gender, age, visual impediments, and self-assessed map reading ability.
-

The dataset comprises maps and aerial photographs of the Falkland Islands. The maps are printers films and final paper printed originals of Falkland Islands OS maps, compiled for the Falkland Islands Government and the Foreign and Commonwealth Office by the Overseas Directorate of the Ordnance Survey. They were discarded by the Ordnance Survey around 2004, and offered to BGS for storage on behalf of the Falkland Islands Government. The Falkland Islands Government retains copyright interest in the maps. There are no access or usage constraints for BGS staff for BGS purposes. The aerial photographs and associated paper overlays represent copies of field slips of geological maps that were compiled by BGS under contract to the Falkland Islands Government. Copyright remains with the Falkland Islands Government , but there are no access or usage constraints for BGS staff for BGS purposes. Access to both datasets are restricted to BGS staff.
-
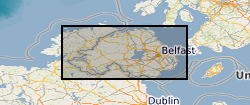
The 1:250k Geological Maps of Northern Ireland comprise the Superficial Deposits Map (Drift, 1991) and the Bedrock Map (Solid Geology, 1997). These maps identify landscape areas based on their lithology. The scale of the maps is 1:250 000 and provides a simplified interpretation of the geology that may be used as a guide at a regional level, but should not be relied on for local geology. Superficial deposits are younger geological deposits formed during the most recent geological time; the Quaternary. These deposits rest on older rocks or deposits referred to as bedrock. The superficial deposits theme defines landscape areas with a geological name and their deposit-type or lithological composition. The Superficial map shows the deposits within the extent of the six Counties of Northern Ireland. The Bedrock map comprises the bedrock geology and contains dykes and geological faults. Bedrock geology describes the main mass of solid rocks forming the earth's crust. Bedrock is present everywhere, whether exposed at surface in outcrops or concealed beneath superficial deposits or water bodies. Geological names are based on the lithostratigraphic or lithodemic hierarchy of the rocks. The lithostratigraphic scheme arranges rock bodies into units based on rock-type and geological time of formation. Where rock-types do not fit into the lithostratigraphic scheme, for example intrusive, deformed rocks subjected to heat and pressure resulting in new or changed rock types; then their classification is based on their rock-type or lithological composition. This assesses visible features such as texture, structure, mineralogy. Dykes defines small, narrow areas of a specific type of bedrock geology; that is igneous rocks which have been intruded into the landscape at a later date than the surrounding bedrock. Geological faults occur where a body of bedrock has been fractured and displaced by large scale processes affecting the earth's crust (tectonic forces). The Bedrock map shows the main bedrock geological divisions in Northern Ireland and coverage extends to the west into the Republic of Ireland. The printed map includes a stratigraphic column. Digital datasets have been derived from the maps and comprise three layers. 1. Superficial polygons, 2. Bedrock polygons and 3. Linear features. Attribute tables describe the polygon features. These data are generalised and superseded by the 1:10k Geological Maps of Northern Ireland.
-
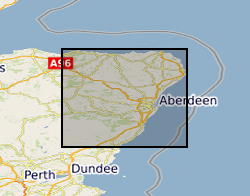
The database contains basic tabulated field data resulting from the work of the BGS East Grampians Project in the early 1980s to mid 1990s. Records include the locations of stations at which field observations were made, structural measurements and sample locations. To this end, the database provides an index to locations and structural data. However, it needs to be stated clearly that labels given to structural elements are largely subjective beyond the identification of bedding. This means that the structural data are largely unusable without a clear understanding of their context and with regard to the primary paper record on which descriptions of the observed structures are recorded. The data are held in MS ACCESS tables which are related via the Station number as the primary key. The coverage is mainly confined to the North East Grampian Highlands of Scotland. The database is currently unused and has not been added to since the end of the East Grampians Project. The station location and structural data are effectively complete. However, fields in the sample database, such as the sample stratigraphy, are largely incomplete because, at the time the data were acquired, the stratigraphy at each station was formally undefined. The most effective way of presenting and investigating the data is via GIS.
-
[This metadata record has been superseded, see http://data.bgs.ac.uk/id/dataHolding/13608195] Scanned images of Geological map 'Standards', manuscript and published maps produced by the Survey on County Series (1:10560) and National Grid (1:10560 & 1:10000) Ordnance Survey base maps. Current holdings over 41,000 maps for Great Britain. The majority of maps were scanned in 2004, any new maps produced are scanned and added to the collection.
-
Photographic negatives of Geological map 'Standards', manuscript and published maps produced by the Survey on County Series (1:10560) and National Grid (1:10560 & 1:10000) Ordnance Survey base maps. Current holdings over 41,000 maps for Great Britain. The majority of maps were scanned in 2004, any new maps produced are scanned and added to the collection. This is essentially a back up collection for disaster recovery.
-
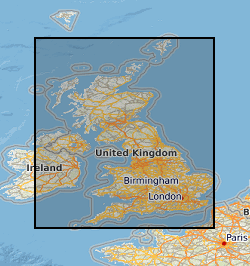
This dataset comprises two collections of maps. The facsmile collection contains all the marginalia information from the original map as well as the map itself, while the georectified collection contains just the map with an associated index for locating them. Each collection comprises approximately 101 000 monochrome images at 6-inch (1:10560) scale. Each image is supplied in TIFF format with appropriate ArcView and MapInfo world files, and shows the topography for all areas of England, Wales and Scotland as either quarter or, in some cases, full sheets. The images will cover the approximate epochs 1880's, 1900's, 1910's, 1920's and 1930's, but note that coverage is not countrywide for each epoch. The data was purchased by BGS from Sitescope, who obtained it from three sources - Royal Geographical Society, Trinity College Dublin and the Ordnance Survey. The data is for internal use by BGS staff on projects, and is available via a customised application created for the network GDI enabling users to search for and load the maps of their choice. The dataset will have many uses across all the geoscientific disciplines across which BGS operates, and should be viewed as a valuable addition to the BGS archive. There has been a considerable amount of work done during 2005, 2006 and 2007 to improve the accuracy of the OS Historic Map Collection. All maps should now be located to +- 50m or better. This is the best that can be achieved cost effectively. There are a number of reasons why the maps are inaccurate. Firstly, the original maps are paper and many are over 100 years old. They have not been stored in perfect condition. The paper has become distorted to varying degrees over time. The maps were therefore not accurate before scanning. Secondly, different generations of maps will have used different surveying methods and different spatial referencing systems. The same geographical object will not necessarily be in the same spatial location on subsequent editions. Thirdly, we are discussing maps, not plans. There will be cartographic generalisations which will affect the spatial representation and location of geographic objects. Finally, the georectification was not done in BGS but by the company from whom we purchased the maps. The company no longer exists. We do not know the methodology used for georectification.
-
This layer of the map based index (GeoIndex) shows the location of available 1:10000 or 1:10560 series paper geological maps. Since the 1960s the standard large scale map for recording geological information has been the Ordnance Survey (OS) quarter sheet, covering a 5km by 5km area. The maps themselves are supplied in different formats depending on their age and the method of compliation or reproduction used. Only the latest and most up-to-date version is listed.
-
This layer of the map based index (GeoIndex) shows the availability of 1:63360 scale geological maps. The maps are available for most of England and Wales and show early geological mapping covering the OS Old Series one inch map sheet areas.