
63360
Type of resources
Topics
Keywords
Contact for the resource
Provided by
Years
Formats
Representation types
Update frequencies
Scale
-
[This metadata record has been superseded, see http://data.bgs.ac.uk/id/dataHolding/13606458] Scanned copies of Scottish 1 inch scale maps which are annotated with fossil locations and geology. Printed topography with hand annotated fossil locations and geology with cross sections and colour-wash with index and observations. Considered working material towards published geological maps.
-

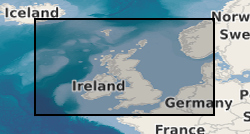
A collection of 1:63 360 and 1:10 560 geological maps of Ireland. The maps were firstly created by the Geological Survey of the United Kingdom and Ireland up until 1905 when the Geological Survey of Ireland was transferred to the Department of Agriculture and Technical Instruction for Ireland. Following this point, the maps were created and published by the Geological Survey of Great Britain (later to become the British Geological Survey). The maps range from 1853 to 1953. Geological maps represent a geologist's compiled interpretation of the geology of an area. A geologist will consider the data available at the time, including measurements and observations collected during field campaigns, as well as their knowledge of geological processes and the geological context to create a model of the geology of an area. This model is then fitted to a topographic base map and drawn up at the appropriate scale, with generalization if necessary, to create a geological map, which is a representation of the geological model. Explanatory notes and vertical and horizontal cross-sections may be published with the map. Geological maps may be created to show various aspects of the geology, or themes. These maps are hard-copy paper records stored in the National Geoscience Data Centre (NGDC) and are delivered as digital scans through the BGS website.
-

The BGS database of geological maps is an index into BGS holdings of modern and historical published geological maps, geological standards and field slips, and also contains a range of other map series, including geophysical maps, geochemical maps, hydrogeological maps, thematic maps and other small-scale miscellaneous non-series maps. Historical vertical and horizontal sections, as well as indices to colours, are also included. The database comprises map metadata, including the title, theme, survey and revision years, publication years, mapped geological theme, base material, map function, colouration, approval status and the spatial extent of each map sheet. An accompanying file store contains high-resolution JPEG2000 scans for delivery, as well as various digital master and delivery formats. For a small number of maps, no scan exists. In total, the database contains over 240,000 scans of over 130,000 maps and field slips. The majority of the maps in the database cover Great Britain, but other regions are also represented, including a historical series of 1-inch maps of Ireland, 6-inch maps of the Isle of Man, 1:25 000 scale maps of the Channel Islands, and various overseas maps. The database contains a record of all geological maps produced by the British Geological Survey and its predecessors since the commencement of systematic geological mapping in the 1830s. The BGS Maps Database is mostly an archive of previous BGS maps, and is not the same as the latest BGS digital mapping. The maps within the database may differ significantly from BGS digital vector mapping. Further information about BGS digital vector mapping is available on the BGS website, under 'BGS Datasets'. The database has evolved over time, originally being a series of discrete databases. These databases have now been aggregated into a single dataset. BGS published maps, as well as 1:10 560 and 1:10 000 large-scale geological maps of England and Wales, and Scotland, are available through the BGS Maps Portal. Field slips and some thematic maps are not included on the BGS Maps Portal. The information about a map is normally a transcription from the map itself. Sometimes key information such as the title may not be actually printed on the map. Where this is the case the information is supplied in square brackets, e.g. [Kirk Maiden]. Information in square brackets means the information is supplied by the cataloguer and is not transcribed from the item.
-

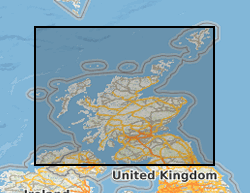
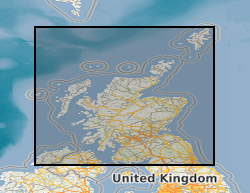
The 1:63 360 / 1:50 000 scale map series are the most useful scale for most purposes. They provide almost complete coverage of onshore Great Britain. The BGS collection of 1:63 360 and 1:50 000 scale maps comprises two map series: - Geological Survey of England and Wales 1:63 360 / 1:50 000 Geological Map Series [New Series]. These maps are based on the Ordnance Survey One-inch New Series topographic basemaps and provide almost complete coverage of England and Wales, with the exception of sheet 180 (Knighton). The quarter-sheets of 1:63 360 Old Series sheets 91 to 110 coincide with sheets 1 to 73 of the New Series maps. These earlier maps often carry two sheet numbers which refer to the Old Series and the New Series. - Geological Survey of Scotland 1:63 360 / 1:50 000 Geological Map Series. These maps are based on the Ordnance Survey First, Second, Third and Fourth editions of the One-inch map of Scotland. The maps used the most recent topographic basemap available at the time. In the Western Isles, one-inch mapping was abandoned and replaced by maps at 1:100 000 scale, which are associated with this series. Sheets were traditionally issued at 1:63 360 scale, with the first 1:50 000 maps appearing in 1972. Sheets at 1:50 000 scale may be either facsimile enlargements of an existing 1:63 360 sheets, or may contain new geology and cartography. The latter bear the additional series designation '1:50 000 series'. Within the Scottish series, new mapping at 1:50 000 scale was split into east and west sheets. For example, the original one-inch sheet 32 became 1:50 000 sheets 32E and 32W. A number of irregular sheets were also introduced with the new 1:50 000 scale mapping. There are a number of irregular special sheets within both series. Geological maps represent a geologist's compiled interpretation of the geology of an area. A geologist will consider the data available at the time, including measurements and observations collected during field campaigns, as well as their knowledge of geological processes and the geological context to create a model of the geology of an area. This model is then fitted to a topographic basemap and drawn up at the appropriate scale, with generalization if necessary, to create a geological map, which is a representation of the geological model. Explanatory notes and vertical and horizontal cross sections may be published with the map. Geological maps may be created to show various aspects of the geology, or themes. The most common map themes held by BGS are solid (later referred to as bedrock) and drift (later referred to as superficial). These maps are, for the most part, hard-copy paper records stored in the National Geoscience Data Centre (NGDC) and are delivered as digital scans through the BGS website.
-
Analogue aeromagnetic surveys of Great Britain for the Geological Survey (GSGB), subsequently digitised. Commercial Analogue survey of North Sea by Aerosurveys Inc, subsequently digitised by BGS. Commercial digital (+ one analogue) surveys off NW/N/NE of Britain by Huntings Geology and Geophysics and ESL, purchased outright by BGS. Local surveys, digital and analogue aeromagnetic (+ other methods) surveys for BGS and commercial companies. Data acquired over many years by different companies. Surveys vary from High Resolution helicopter covering a few square kms to regional surveys covering 1000s of square kms. Some data recorded analogue, subsequently digitised, other data full digital capture with GPS navigation. Approximately 75% of the bounding rectangle covered. Flight line separation varies between 2km and 0.4km, line spacing typically 2km over UK but 0.4km over Devon/Cornwall. Flight line separation for Aerosurveys/Huntings surveys vary between 6.4 to 15 km. Detailed surveys at various resolutions. Along line spacing varies, analogue data: digitised from 1:63 360 and 1:253 440 scale map sheets and digital surveys: Decca navigation, 305m asl (above sea level). Local helicopter surveys, analogue and digital recordings, various survey heights. HiRES survey, full digital data capture at 0.1 sec intervals, GPS navigation, 90m survey height.
-
Annotated Scottish 1 inch scale maps. Printed topography with hand annotated fossil locations and geology with hand drawn cross sections, colour-wash with index and observations. Considered working material towards published geological maps.
-

Index to Statutory Borehole Notifications of intent to drill a borehole for water supply.
-

These maps are based on the Ordnance Survey 'Old Series' One-Inch maps of England and Wales. They were the first 1:63 360 geological map series produced by the Geological Survey in England and Wales. Sheets were initially published as full sheets, and later as quarter sheets (NW, NE, SW, SE). Earlier maps are hand-coloured, later maps are colour-printed. The maps show both solid and drift geology. The OS 'Old Series' maps extended as far north as a line drawn between Preston and the Humber. To the north of this, the maps use the same sheetlines as the 1:63 360 New Series, and carry two sheet numbers, which refer to the Old Series (91-110) and New Series (1-73) numbering. These maps are common to both series. A sheet that covers the Isle of Man is also included in the series. Geological maps represent a geologist's compiled interpretation of the geology of an area. A geologist will consider the data available at the time, including measurements and observations collected during field campaigns, as well as their knowledge of geological processes and the geological context to create a model of the geology of an area. This model is then fitted to a topographic basemap and drawn up at the appropriate scale, with generalization if necessary, to create a geological map, which is a representation of the geological model. Explanatory notes and vertical and horizontal cross sections may be published with the map. Geological maps may be created to show various aspects of the geology, or themes. These maps are hard-copy paper records stored in the National Geoscience Data Centre (NGDC) and are delivered as digital scans through the BGS website.
-

A collection of hydrogeological maps created by the British Geological Survey between 1967 and 1994. The maps in the collection cover aspects of groundwater availability, exploitation and quality, and were published at various scales from 1:25 000 to 1:625 000. A hydrogeological map is a specialized type of map that illustrates the distribution and characteristics of hydrogeological features in a particular area. Hydrogeological maps of the UK provide information on major aquifers, including geological and lithological information, surface drainage systems and water quality issues. The 23 maps show information on surface water features, the three dimensional geometry of aquifers, groundwater levels, abstractions and quality including saline intrusion in varying amounts of detail. They range in scale from 1:625 000, for the national map of the hydrogeology of England and Wales, down to 1:25 000 for some of the smaller regional maps. These maps are important tools for understanding and managing groundwater resources, as well as for addressing water-related environmental issues. These maps are hard-copy paper records stored in the National Geoscience Data Centre (NGDC), and are delivered as digital scans through the BGS website.