
1977
Type of resources
Topics
Keywords
Contact for the resource
Provided by
Years
Formats
Representation types
Update frequencies
Scale
-
A collection of seventy-eight maps covering thirteen National Grid 1:10 560 map sheets in the area of the Lothian oil shale field published between 1977 and 1982. Each map shows the extent of a single oil shale seam. An oil shale seam refers to a layer or deposit of sedimentary rock rich in organic material known as kerogen, which has the potential to yield hydrocarbons such as oil and gas through a process called pyrolysis. Oil shale is different from conventional oil and gas reservoirs in that the hydrocarbons are not present in a liquid or gaseous form but are trapped within the solid structure of the shale rock. The maps were published by the Institute of the Geological Sciences in Edinburgh (previous name for the British Geological Survey). This entry relates to hardcopy maps stored in the National Geological Data Centre (NGDC) and digital files produced by scanning them, as well as any derivative files. These maps are hard-copy paper records stored in the National Geoscience Data Centre (NGDC).
-

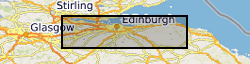
**has been incorporated into the main BGS Landslides database**The dataset results from a survey of the landslips in the South Wales Coalfield, conducted on contract for the Department of the Environment in 1977-81. A total of 579 landslips were identified from air photo interpretation and existing mapping. Each landslip was examined in the field and a catalogue compiled including data on location, description, classification, geological context, dimensions and activity. The data is also presented on c. 90 annotated field sheets at 1:10 000 scale and in other supporting documentation.
-
Recordings of earthquakes and other signals (such as quarry blasts, explosions, sonic booms and collapses) made by a network of seismometers and similar sensors across the UK. Recordings start in 1977 (with a few events recorded before this) and continue to the present day. Data is used for monitoring of seismic activity, studies of seismic hazard and scientific study of the Earth's interior. Data is freely available on request. Some data can be retrieved from the BGS AutoDRM (Automatic Data Request Manager) service. Time series data recorded by UK seismic networks.
-

The UTM series of maps are based on 1:250 000 base maps published by the Ordnance Survey. Mapping is divided into squares which cover 1 degree by 1 degree of latitude / longitude in the Universal Transverse Mercator (UTM) projection, and coverage extends offshore and onto the continental shelf. The UTM series are available in three different themes: - Solid geology (complete coverage within the mapped area, including most of the UK continental shelf) - Sea bed sediments (coverage for most offshore areas) - Quaternary geology (coverage for the UK sector of the North Sea, Irish Sea and the Atlantic margin) Also included within this series are two small-scale (1:500 000) bedrock geology maps of the Central Rockall Basin and North Rockall Basin. These maps supersede the older quarter-inch series of maps which were published for England / Wales and Scotland. Geological maps represent a geologist's compiled interpretation of the geology of an area. A geologist will consider the data available at the time, including measurements and observations collected during field campaigns, as well as their knowledge of geological processes and the geological context to create a model of the geology of an area. This model is then fitted to a topographic basemap and drawn up at the appropriate scale, with generalization if necessary, to create a geological map, which is a representation of the geological model. Explanatory notes and vertical and horizontal cross sections may be published with the map. These maps are, for the most part, hard-copy paper records stored in the National Geoscience Data Centre (NGDC) and are delivered as digital scans through the BGS website.
-

Reports on the Geothermal Potential of the UK.