
Geophysics
Type of resources
Available actions
Topics
Keywords
Contact for the resource
Provided by
Years
Formats
Representation types
Update frequencies
status
Service types
Scale
Resolution
-

Values of the geomagnetic field vector components computed from measurements made on land, at sea and in the air since 1900 all round the world. Repeat station data (collected at one location over many years and reduced to a magnetically quiet level) are an important part of this dataset. These data are useful for charting the Earth's magnetic field on time scales of years to decades.
-

This dataset includes numerical simulation data of bottom heated convection in a rotating spherical shell. These numerical models are used to investigate the dynamics of convection in planetary cores. The simulations are performed over a range of thermal forcing and rotation rate [1-3] to study the various dynamical regimes of rotating convection. The dataset includes the simulation states to reproduce the simulations, time-series output of relevant variables from the simulations apart from post-processed diagnostic quantities. Due to large volume of the simulation state files only the initial, final and time averaged files are stored in the dataset in NETCDF format. The simulation diagnostics are provided in text, which includes time series, spatial and temporal averages of various diagnostic quantities (e.g. kinetic energy of convection) and forces to assess the underlying dynamics and heat transfer behaviour. The simulations have been performed using the Leeds Spherical Dynamo code [4], using ARC2, ARC3 and ARC4 HPC system in University of Leeds and the ARCHER and ARCHER2 HPC system. Refs: [1] https://doi.org/10.1017/jfm.2017.539 [2] https://doi.org/10.1017/jfm.2020.67 [3] https://doi.org/10.48550/arXiv.2410.03369 [4] https://github.com/Leeds-Spherical-Dynamo/leeds-spherical-dynamo
-
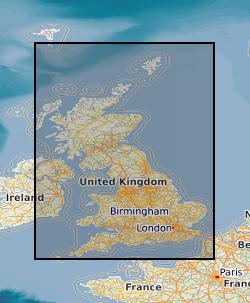
This low-resolution image has been produced from BGS airborne and marine magnetic data. The colour was generated using the BGS COLMAP software package. Colour levels are defined by histogram equalisation. Combining this image with the grey shaded relief image produces a similar image to the colour shaded relief image. A published coloured shaded relief map, using the full resolution of the data and produced at a scale of 1: 1500 000, is available. The map covers a larger area than this image, and includes additional data from other sources. The data used to compile this image are available in various forms for academic and commercial licensing. The data from surveys covering the UK mainland have been digitised from their original analogue form. Elsewhere data were acquired digitally. Standard methods of processing were used to remove diurnal and secular variations and to minimise line intersection errors. While efforts have been made to remove artefacts from the data, some may remain between adjacent datasets. Generally anomalies over man-made structures have not been removed. The data have been interpolated onto a 1km x 1km grid using a variable tension technique, and smoothed.
-
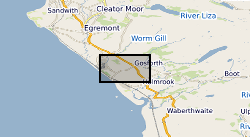
A collection of reference drawings relating to investigations carried out by Nirex, during the period from 1989 to 1997. The drawings summarise the status of the geological investigation at Sellafield and include borehole locations, geology (surface, structure, sections etc) and geophysics (seismic, airborne, etc). Sites near Sellafield, in Cumbria, and Dounreay, in Caithness. The Nirex (Nuclear Industry Radioactive Waste Executive) geological archive was transferred to the British Geological Survey during 2000/2001. The BGS has undertaken to retain the records for a minimum of 50 years as part of its national geological archive. The ownership of Nirex was transferred from the nuclear industry to the UK Government departments DEFRA and DTI in April 2005, and then to the UK's Nuclear Decommissioning Authority (NDA) in November 2006.
-
Collection of annual publications from the global network of magnetic observatories. They typically contain tabulations of hourly, monthly and annual mean values of the geomagnetic elements. Contains all magnetic observatory year books held by the World Data Centre for Geomagnetism (Edinburgh).
-

This dataset contains monthly mean magnetic data from the Greenwich Observatory from 1841 to 1925. This dataset is the result of report https://nora.nerc.ac.uk/id/eprint/536965/ and is the published product of a study by the British Geological Survey (BGS). The main aim was to create a digital record of the monthly magnetic data stored in the Greenwich Magnetic Observatory yearbooks for 1841 to 1925, for the magnetic research community to use. The report also details the steps taken to convert the inclination and declination, from various published units to standardised units (arcminutes). We have also attempted to convert the horizontal and vertical force values published from 1868 to 1911 from British, and Gauss units to nanoTeslas, however, due to inconsistencies in the scaling factors, and time constraints, we have had limited success. Post-1912 the horizontal and vertical force data has successfully been converted into nanoTesla. Greenwich Magnetic Observatory (GRW) is located at 51°29'N 0°0'E 0m elevation. Observatory info can be found at: https://geomag.bgs.ac.uk/operations/greenwich.html The observatory yearbooks can be found at: http://www.geomag.bgs.ac.uk/data_service/data/yearbooks/grw.html A report describing this data set and its construction can be found at: https://nora.nerc.ac.uk/id/eprint/536965/
-

The results of research carried out under NERC research grant schemes. A variety of different types of research and results are lodged with the NGDC's Earth Science Academic Archive (ESAA) as the NERC Designated Data Centre. Individual data sets will have their own entries where appropriate.The research is all linked to Earth Science and is carried out worldwide. The ESAA also maintains the results of similar academic research that has not been funded by NERC.
-

Geophysical survey data from Fluid Processes and Waste Management projects for UK and European investigations. Data comprise distinct surveys using a variety of geophysical methods and equipment. All data held electronically as XYZ ASCII-type data points.
-

GeoIndex Historical Surveys This aeromagnetic survey was carried out by Canadian Aeroservices on behalf of the Northern Ireland Government in 1959 as part of a UK wide survey.
-

Leeds dynamo simulations for the analysis of rapid changes in the geomagnetic field. In each folder, the following file can be found: - state.cdf.in - the configuration file used as an intial condition to launch each simulation Some folders have multiple state.cdf.in files for each run of the same simulation, if only part of the data was needed to be reproduced. Additionally, most folders contain: - LSD.info/main.info - Contains details of the parameters for each simulation, which can be used for reference when recompiling the code - LSD.out/main.out - the exectuable used to submit a simulation to a hpc; for the code to be reran, this would have to be recompiled (see Leeds_Dynamo_Code_Manual.pdf) - run.bolt/run.sh - the scripts used to submit a simulation to the leeds hpc (.sh file) or archer2 (.bolt file) Details of how to run the Leeds dynamo code can be found in Leeds_Dynamo_Code_Manual.pdf, which contains a more in-depth description of input parameters, boundary conditions, output data etc. The parameters for each simulation can also be found in the spreadsheet 'SimulationsLog'. More details about the difference between thermally-driven and thermochemically-driven cases can be found in Nakagawa and Davies, 2022. Note all simulations have Prandtl number Pr=1. We have ran a series of simulations to help us elucidate the origin of rapid changes in the Earth's magnetic field. Observational models of the magnetic field have found changes in field intensity and direction that significantly faster than the values and averages for the modern field. The simulations provided here have been analysed to find the features that best reproduce dynamical and morphological agreement with the observed field, as well as to find rapid changes in the simulated field that are in agreement with that of the observed field (see Nakagawa and Davies 2022). Simulations have been ran using the Leeds Dynamo Code, and the configuration files provided here allow users to reproduce and interpret the data used for analysis.