2023
Type of resources
Available actions
Topics
Keywords
Contact for the resource
Provided by
Years
Formats
Representation types
Update frequencies
Scale
Resolution
-
Rheometry data on ash from Mt Meager, British Columbia, Canada. All measurements that generated these data were performed using an Anton Paar MCR302 rotational rheometer with an Anton Paar powder flow cell attached. The rotating measuring geometry is 24.16 mm in diameter and contains 20 evenly spaced depressions of 1.75 mm that extend the entire length of the measuring cylinder. The profiled nature of this geometry prevents particle slip during rotation. Shear rate sweeps were performed to characterise the rheological behaviour of our pyroclast-gas mixtures. ~50 g of sample (ash from Mt Meager, British Columbia, Canada) was loaded into the powder flow cell with the measuring geometry inserted. Then for a constant gas flux applied to the base of the powder flow cell, the measuring geometry was rotated to apply a range of shear rates starting at 0.1 s-1 ramping up to 328 s-1 with approximately 20 data points generated per decade. These shear rate sweeps were performed for monodisperse grain sizes from 500 µm to 63 µm at a range of volumetric gas flow rates. Specifically for the 500 µm sample the rheology experiments were performed at 0, 15, 30, 45, 50, 55, 60, 65, and 70 L min-1. For the 250 µm sample the rheology experiments were performed at 0, 15, 20, 25, 30, 35, and 40 L min-1. For the 125 µm sample the rheology experiments were performed at 0, 1, 2, 3, 4, 5, 7, 8, 9, and 10 L min-1. For the 63 µm sample the rheology experiments were performed at 0, 0.25, 0.5, 1, 1.5, 2, 3, 4, and 5 L min-1.
-
This dataset includes raw point cloud data from repeat terrestrial laser scans (TLS) for a field of protodunes that initiated and developed on a desert gravel interdune surface close to Helga's dune at Gobabeb, Namibia. As well as the TLS data, additional measurements of the wind speed through a CSAT 3D sonic anemometer and sediment transport using a Sensit.
-
X-discontinuity observations recorded from receiver function stacks of passive-source seismic data. Receiver functions are recorded between January 1990 and October 2021 at numerous seismometers on the African continent (see Pugh et al., 2023 for details). Receiver functions are downloaded, processed using SMURFPy (Cottaar et al., 2020). They are subsequently stacked in the depth and time-slowness domains in 1 degree radius overlapping bins and interpreted for the presence of the X-discontinuity. The dataset comprises 597 stacks, their location, the depth of the X-discontinuity, a classification of the stack and the amplitudes of the X-discontinuity. See Pugh et al., 2023 for further details on the method, the code used to download, process and stack receiver functions can be found at: https://doi.org/10.5281/zenodo.4337258 Pugh et al., 2023 - Multigenetic Origin of the X-discontinuity Below Continents: Insights from African Receiver Functions.
-
Stable isotope data of organic carbon, nitrogen and sulfur as well as trace elements are used to explore how proxies with differing residence times in seawater respond to changes in the basin’s connectivity to the open ocean. The results show that species with a short residence time, such as nitrate and rare earth elements, may be more sensitive to geologically brief fluctuations in oceanographic conditions than long-lived species like sulfate. Details about the methodology and sampling strategy can be found in Stu¨eken, E.E., Viehmann, S. and Hohl, S.V., 2023, ACS Earth and Space Chemistry, 7(7), pp.1337-1349.
-
This information details the method of calculating dilatancy from pore volumometry measurements. In the velocity step tests, an initial shear enhanced compaction phase drastically reduces the sample pore volume until the sample yields. After the sample yields, the pore volume continues to decrease but at a lower rate of decrease. The imposed velocity steps cause compaction or dilation of the sample material that is superimposed on this overall compaction trend. Pore pressure is held at a set point in all tests and any volume changes in the control system are assumed to correspond directly to changes in pore volume in the sample. The method here is aimed at producing quantitative, reproducible values for dilatancy from experimental data. The script fits a polynomial function to all the volume data to give the overall trend of the shear enhanced compaction. The data position of the start of the velocity step of interest is entered manually into the function. When dilatancy occurs on a step change in velocity, this is not immediately recorded using volumometry, as the permeability of the sample will produce a transient response as pore fluid pressure equilibrates between the sample and the pore fluid pressure system. To discount time effects, every velocity step was processed with a ‘time_dep’ phase for the first 100µm of displacement after the imposed velocity step change. Using the values for ‘vel_step’ and ‘time_dep’, the volumometry data are split into separate matrices incorporating time and volume preceding and following the velocity step change. A linear regression model fits a polynomial curve to the pore volumometry data and returns the coefficient of determination (R2) for the fit of the model. The shear enhanced compaction phase prior to yield is included in the fit. The code incrementally adds the value entered for ‘step’ to the data in the velocity step of interest. This ‘step’ value is a positive or negative value depending on whether the velocity has increased or decreased, respectively. A new linear regression model is then fitted to the whole dataset and if the R2 value has increased, the code will continue to loop to add the value of ‘step’ to the pore volume data. It concludes when the R2 value reaches a peak and begins to decrease, as the fit is no longer improving. We assume at this point that the effect of the dilatancy due to the velocity step has been removed, and the cumulative sum of the ‘step’ values is equivalent to the dilatancy. As the loop goes one iteration past the optimum R2 value, the code reverts to the previous set of values with the best R2 value. In experiments with multiple velocity step changes, the code needs to retain the previous corrections of the data. The function ‘pf_correct’ is used to correct the velocity steps that have been previously processed. The values for ‘vel_step’, ‘time_dep’ and the returned value of ‘offset’ need to be given in the inputs for ‘pf_correct’.
-
Contains standard luminescence measurement files output from the Risø reader (SEC, SEQ, and BINX file types). This data set is comprised of standard files associated with a Risø Luminescence Reader. 48 sediment samples from New Zealand were analyzed using a modified version of pIRIR infrared analysis of feldspars, the 3ET protocol. Sample lab codes are listed in a separate file, along with corresponding site location IDs, field codes, and depth below surface. Three file types are included in this dataset: sec files: Contain the series of commands issued to the Risø Reader for a particular run. txt format, readable by Notepad or similar software. SEQ files: Sequence file used for programming in run sequences. These files are readable with Risø Sequence Editor software. binx files: A binary output file that records measurements made by the Reader. The format is described in Risø's software manuals and is typically accessed using the Risø Analyst software. The file in this data set have names that include the 5-digit sample lab code. A file can contain data from one or more samples. The word 'restart' appears in files where a machine run was interrupted and had to be restarted. The code 'MU' indicates a run where fading measurements were collected. A complete description of the Risø TL/OSL Reader, software, and associated file formats is available at: https://www.fysik.dtu.dk/english/research/radphys/research/radiation-instruments/tl_osl_reader Free software for accessing binx and SEQ files is also available at the DTU link.
-
Laser ablation ICPMS data for Fe-Ni-Cu sulfides from Ivrea, northern Italy (NERC Grant NE/P017312/1)
These files contain data for microscopy and mineral analyses on Fe-Ni-Cu sulfide minerals in the lower crust below arc systems using the example of the Ivrea Zone in Italy. Samples are lower crustal cumulates with variable concentrations of Fe-Ni-Cu sulfides collected by Dave Holwell from the Ivrea Zone. The sample details will be logged in a separate data entry and more information can be found in the open access paper by Holwell et al (2022) in Nature Geoscience, https://doi.org/10.1038/s41467-022-28275-y. Data were acquired during 2019, 2020 and 2021. Folders include: metadata (time-resolved analysis spectral data) for laser ablation ICP-MS analysis of sulfide minerals. Laser-ablation ICPMS analyses were performed using a ESI UP213 laser system coupled to a Thermo iCAPRQ ICP-MS system at the School of Earth and Environmental Sciences, Cardiff University. The data were gathered to understand the concentrations of precious and semi-metal trace elements and their likely mineral forms in the various Fe-Ni-Cu sulfide minerals. Collected under the From Arc Magma to Ore System (FAMOS) Project.
-
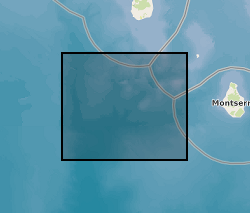
Earthquake hypocenters for all earthquakes detected on Montserrat by the Montserrat Volcano Observatory seismic network from July 1995 to February 2018 inclusive. Information includes: Origin Time, Latitude, Longitude, Depth, Hypocenter Errors, RMS and the number of stations used for each location.
-
This dataset contains major, trace, and volatile element contents, and sulfur isotope ratio data measured in silicate glasses found in volcanic rocks from the Central American Volcanic Arc. The files have been first published as supplementary data in: Taracsák et al. (2023): Sulfur from the subducted slab dominates the sulfur budget of the mantle wedge under volcanic arcs, Earth and Planetary Science Letters, 601:117948 The data is also accessable via the following DOI: https://doi.org/10.1016/j.epsl.2022.117948
-

Major and trace element data for plagioclase and whole-rocks from Japan sampled and filtered from the GEOROC online database (http://georoc.mpch-mainz.gwdg.de/georoc, state: 1 January 2017). The data was used to test the recently developed plagioclase porphyry indictor mineral, as described in Williamson et al. (2016, Nature Geoscience, 9: 237-241), on samples from Japan. Japan is considered a negative control as it has no known porphyry deposits, despite showing favourable geology. The data was used in Williamson B.J., Hodgkinson M., Imai A., Takahashi R., Armstrong R.N., Herrington, R.J., 2018. Testing the Plagioclase Discriminator on the GEOROC Database to Identify Porphyry-Fertile Magmatic Systems in Japan, Resource Geology, 68: 138-143.
 NERC Data Catalogue Service