data.gov.uk (non-INSPIRE)
Type of resources
Available actions
Topics
Keywords
Contact for the resource
Provided by
Years
Formats
Representation types
Update frequencies
Service types
Scale
Resolution
-
Scanned collection of seismological journals and offprints. The original collection was compiled by John Wartnaby. John Wartnaby was a curator at the Science Museum, London, and wrote a historical survey of seismology and scientific instruments. His accumulated papers consist chiefly of offprints and articles, and many older British Association seismological reports. The collection is part of the National Seismological Archive.
-
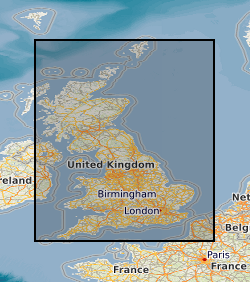
The 5km Hex GS Landslides dataset shows a generalised view of the GeoSure Landslides v8 dataset to a hexagonal grid resolution of 64.95km coverage area (side length of 5km). This dataset indicates areas of potential ground movement in a helpful and user-friendly format. The rating is based on a highest level of susceptibility identified within that Hex area: Low (1), Moderate (2), Significant (3). Areas of localised significant rating are also indicated. The summarising process via spatial statistics at this scale may lead to under or over estimation of the extent of a hazard. The supporting GeoSure reports can help inform planning decisions and indicate causes of subsidence. The methodology is based on the BGS Digital Map (DiGMapGB-50) and expert knowledge of the behaviour of the formations so defined. This dataset provides an assessment of slope instability. Landslide hazard occurs due to particular slope characteristics (such as geology, gradient, sources of water, drainage, man-made constructions) combining to cause the slope to become unstable. Downslope movement of materials, such as a landslide or rockfall may lead to a loss of support and damage to buildings. Complete Great Britain national coverage is available.
-
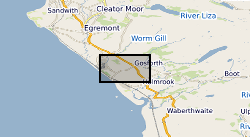
A collection of reference drawings relating to investigations carried out by Nirex, during the period from 1989 to 1997. The drawings summarise the status of the geological investigation at Sellafield and include borehole locations, geology (surface, structure, sections etc) and geophysics (seismic, airborne, etc). Sites near Sellafield, in Cumbria, and Dounreay, in Caithness. The Nirex (Nuclear Industry Radioactive Waste Executive) geological archive was transferred to the British Geological Survey during 2000/2001. The BGS has undertaken to retain the records for a minimum of 50 years as part of its national geological archive. The ownership of Nirex was transferred from the nuclear industry to the UK Government departments DEFRA and DTI in April 2005, and then to the UK's Nuclear Decommissioning Authority (NDA) in November 2006.
-
High frequency (100 Hz) data from two horizontal induction coils measuring the Earth's magnetic field at the Eskdalemuir Observatory in the United Kingdom. The data covers the period from January 2013 to December 2013. Also included are examples of Matlab code and the frequency calibration files to convert to the raw data to SI units. Thumbnail spectrograms and metadata about the setup and equipment is also supplied.
-

These files contain ground penetrating radar (GPR) data collected from the glacier margins and forelands of Falljökull and of Kvíárjökull, south-east Iceland, between 2012 and 2014. The data were collected using a Sensors and Software PulseEKKO Pro GPR system. For each glacier the data are stored in folders that indicate the month and year in which the surveys were conducted. Each GPR profile has a Sensors and Software GPR (.DT1) file, and associated header (.HD) and GPS (.GPS) files. The .HD files (which can be opened as text files) give the parameters and equipment used for each profile. GPS files are not available for some of the profiles collected on Falljökull in April 2013 (due to damage that occurred to the GPS linked with the PulseEKKO Pro system). For these profiles start, finish, and mid profile positions were recorded using differential GPS, and locations of these profiles are instead given by GIS shapefiles in the relevant folders. These datasets have been used in the publications listed below. Further information relating to the data collection methodology can be found therein. Phillips, Emrys; Everest, Jez; Evans, David J.A.; Finlayson, Andrew; Ewertowski, Marek; Guild, Ailsa; Jones, Lee. 2017 Concentrated, ‘pulsed’ axial glacier flow: structural glaciological evidence from Kvíárjökull in SE Iceland. Earth Surface Processes and Landforms, 42 (13). 1901-1922. https://doi.org/10.1002/esp.4145 Phillips, Emrys; Finlayson, Andrew; Bradwell, Tom; Everest, Jez; Jones, Lee. 2014 Structural evolution triggers a dynamic reduction in active glacier length during rapid retreat: evidence from Falljökull, SE Iceland. Journal of Geophysical Research: Earth Surface, 119 (10). 2194-2208. https://doi.org/10.1002/2014JF003165 Phillips, Emrys; Finlayson, Andrew; Jones, Lee. 2013 Fracturing, block-faulting and moulin development associated with progressive collapse and retreat of a polar maritime glacier: Virkisjokul-Falljokull, SE Iceland. Journal of Geophysical Research: Earth Surface, 118 (3). 1545-1561. https://doi.org/10.1002/jgrf.20116 Flett, Verity; Maurice, Louise; Finlayson, Andrew; Black, Andrew; MacDonald, Alan; Everest, Jez; Kirkbride, Martin. 2017. Meltwater flow through a rapidly deglaciating glacier and foreland catchment system: Virkisjökull, SE Iceland. Hydrology Research, 48 (6). 1666-1681. https://doi.org/10.2166/nh.2017.205
-
High frequency (100 Hz) data from two horizontal induction coils measuring the Earth's magnetic field at the Eskdalemuir Observatory in the United Kingdom. The data covers the period from January 2019 to December 2019. Also included are examples of Matlab code and the frequency calibration files to convert to the raw data to SI units. Thumbnail spectrograms and metadata are also supplied.
-
Records of all onshore (or near shore) boreholes, trial pits, shafts and wells held in the BGS archives in either paper, microfilm or digital format. The records range from simple single page lithological logs through to hydrocarbon completion reports. Spatial coverage will vary considerably depending on drilling activity, collecting activity and donations. The majority of new data is from site investigation reports with concentrations in urban areas and along transport routes. Current collection over 1million records covering the whole of Great Britain with 50,000 new records added per annum. Some records date back to 1600 but the majority date from 1900 onwards. Copies of records are available in hard copy or digital formats subject to confidentiality.
-
Scanned images of seismic phase data sheets containing phase readings, phase arrival times, amplitude data, magnitude data and derived source information like hypocentres (locations), fault plane solutions etc for earthquakes recorded by BGS seismic stations. The data is in the format used by the location program HYPO71 (Lee & Lahr, 1975) which was the most used program for local earthquakes.
-
This addition to the GeoSure ground stability data consists of a single data layer in Geographical Information System (GIS) format that identifies areas of potential shrink-swell hazard at subcrop level (up to 10 metres depth) in Great Britain. It is essentially a national hazard susceptibility map. This data has been produced by geologists, geotechnical specialists and information developers at the British Geological Survey and is presented as a GIS data layer. Swelling clays can change volume due to variation in moisture, this can cause ground movement, particularly in the upper two metres of the ground that may affect many foundations. Ground moisture variations may be related to a number of factors, including weather variations, vegetation effects (particularly growth or removal of trees) and the activities of people. Such changes can affect building foundations, pipes or services.
-
High frequency (100 Hz) data from two horizontal induction coils measuring the Earth's magnetic field at the Eskdalemuir Observatory in the United Kingdom. The data covers the period from January 2018 to December 2018. Also included are examples of Matlab code and the frequency calibration files to convert to the raw data to SI units. Thumbnail spectrograms and metadata are also supplied.
 NERC Data Catalogue Service