
2018
Type of resources
Available actions
Topics
Keywords
Contact for the resource
Provided by
Years
Formats
Representation types
Update frequencies
status
Service types
Scale
Resolution
-
This data includes information about nitrogen fixation, phosphatase activity, plant nitrogen and phosphorus demand and soil nitrogen and phosphorus availability of nitrogen-fixing and non-fixing trees from seven species grown in an experimental plantation at the Agua Salud Native Species Plantation, El Giral, Panama (9°12'50.15''N, 79°43'26''W). Data were collected by the Smithsonian Tropical Research Institute and Princeton University and were analysed by the University of Leeds. This work was funded by the following organisations: Heising-Simons Foundation, Hoch Family, ForestGEO®, HSBC, Stanley Motta, Small World Institute Fund, Smithsonian Institution's Competitive Grants for Science, Smithsonian Institution's Grand Challenges, National Science Foundation (award reference: EAR-1360391), National University of Singapore, Smithsonian Tropical Research Institute, Yale-NUS college, Princeton University, Princeton Environmental Institute, Princeton Carbon Mitigation Initiative, University of Leeds and NERC (award reference: NE/M019497/1) Full details about this dataset can be found at https://doi.org/10.5285/3578bae2-4b88-4b2e-93e1-6965dfe1348c
-
This dataset contains data from a soil survey at Moor House, Cumbria, UK undertaken by Mike Hornung in 1965 as part of his PhD. It contains information about the soil horizons, chemical analyses and soil mineralogy. Full details about this dataset can be found at https://doi.org/10.5285/e4cf73b0-eef6-4118-a018-40eb374f5de7
-
This web map service (WMS) is the 25m raster version of the Land Cover Map 2015 (LCM2015) for Great Britain and Northern Ireland. It shows the target habitat class with the highest percentage cover in each 25m x 25m pixel. The 21 target classes are based on the Joint Nature Conservation Committee (JNCC) Broad Habitats, which encompass the entire range of UK habitats.
-
The dataset provides observational information on events when humans are in contact with poultry in rural and urban Bangladesh. Data were collected during observation periods of three hours duration in three settings where humans and poultry have close interactions: rural households with domestic poultry and small-scale commercial farms in rural areas of Tangail district and market stalls that sell, slaughter and process live poultry in Dhaka city. Observations on hygiene or handwashing behaviours that take place before or after contact with poultry, poultry products (eggs, meat) or poultry waste (bedding, faeces or carcasses) were also recorded. A structured observation sheet was used to record the number of occurrences of pre-defined activities. The objective was to record the types of contact behaviours and proportion of human-poultry interactions that could result in human exposure to antibiotic-resistant bacteria carried by poultry. The research was part of a wider research project, Spatial and Temporal Dynamics of Antimicrobial Resistance (AMR) Transmission from the Outdoor Environment to Humans in Urban and Rural Bangladesh. The research was funded by NERC/BBSRC/MRC on behalf of the Antimicrobial Resistance Cross-Council Initiative, award NE/N019555/1. Full details about this dataset can be found at https://doi.org/10.5285/76f52a38-7a2c-49a3-b86f-cc40205459ef
-
The dataset comprises biochemical measurements of salt marsh soil, and samples from fields on former salt marsh, taken using a soil corer. Sampling was conducted at three restored salt marshes and six accidentally breached sites on the Essex coast, UK, providing a chronosequence from 16 to 114 years since restoration of tidal flow. Natural salt marsh at all sites were also sampled, along with adjacent fields on former salt marsh (where access permitted). All salt marsh sampling took place in October 2011. Field sample sites were sampled between July 2010 and April 2017. This data was collected as part of the NERC Centre for Ecology & Hydrology's Multi-functional land-use options project (C03463) in order to determine the trajectory and timescale of habitat recovery, and provide empirically-based predictions of changes in the rate of carbon sequestration over time following saltmarsh restoration. Data is also represented for fields on former saltmarsh to give a 'before' time point to be able to calculate these changes. Full details about this dataset can be found at https://doi.org/10.5285/0b1faab4-3539-457f-9169-b0b1fbd59bc2
-
This dataset contains the answers gathered from the 806 participants who successfully finished an on-line survey on risk perception of environment-associated risks. The survey was launched on the 15th of February 2018 and ran for five days. The survey contained best worst scaling (BWS) to understand people's perceptions to certain risks. In this study sixteen risks were included in the BWS including four air-, food- and waterborne illnesses and twelve other hazards. The BWS was run in two blocks to consider two factors: first the respondents selected which risk they fear the most/least and in the second block they selected the risk they believed they had the most/least control. The survey also contained a detailed questionnaire on the participants eating habits and health status. Participants were also asked about their knowledge on enteric pathogens and whether they have ever sought or would consider seeking advice on the symptoms. Respondents were also asked whether they have experienced the hazards described in the BWS and whether they have done anything to reduce the risks in their life. The data were collected to gather information on people perceptions on environment-associated risks. This was done to understand the common knowledge on environment-associated pollutants and enlighten issues regarding risk management and mitigation. The data were collected as part of the VIRAQUA project was funded by the Natural Environment Research Council (NERC) under the Environmental Microbiology and Human Health (EMHH) Programme (NE/M010996/1). Full details about this nonGeographicDataset can be found at https://doi.org/10.5285/0869d961-99ca-4946-9192-f35afccdda38
-
Stable Isotope and trace element analyses (Ca, Sr, Mg, Fe and Mn concentrations) derived from Cretaceous Belemnites including Duvalia tornajoensis, D. cf. lata constricta, D. binervia, D. cf. emericii, Hibolithes, H. cf. jaculoides, Berriasibelus, Castellanibelus and Pseudobelus.
-
This web map shows positive plant habitat condition indicators across Great Britain (GB). This data provides a metric of plant diversity weighted by the species that you would expect and desire to have in a particular habitat type so indicates habitat condition. In each Countryside Survey 2007 area vegetation plot the number of positive plant habitat indicators (taken from a list created from Common Standards Monitoring Guidance and consultation with the Botanical society of the British Isles (BSBI)) for the habitat type in which the plot is located are counted. This count is then divided by the possible indicators for that habitat type (and multiplied by 100) to get a percentage value. This is extrapolated to 1km squares across GB using a generalised additive mixed model. Co-variables used in the model are Broad Habitat (the dominant broad habitat of the 1km square), air temperature, nitrogen deposition, sulphur deposition, precipitation and whether the plot is located in a Site of Special Scientific Interest (SSSI) (presence or absence data).
-
This dataset consists of ammonia (NH3) measurements from a set of ALPHA (Adapted Low-cost Passive High Absorption) sampler sites at Ballynahone National Nature Reserve, a designated Area of Special Scientific Interest (ASSI), Special Area of Conservation (SAC) and Ramsar (wetland of international importance designated under the Ramsar Convention) site in Northern Ireland. The park is an ammonia sensitive peatland ecosystem managed locally by Ulster Wildlife Trust (UWT). The data were originally collected due to concern that Ballynahone Bog may be adversely affected by NH3 emissions arising from local livestock installations. Full details about this dataset can be found at https://doi.org/10.5285/245f0abf-b7fd-4573-9dde-d6eee4d006a7
-
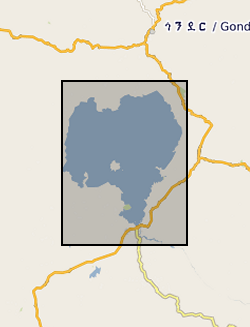
Zr/Rb, Ca/Ti, Rb/K ratios against depth (0.112 m to 62.686 m) and age ( 366 to 150190 yrs). NERC grant, NE/D012996/1, abstract Lake Tana, in the highlands of northern Ethiopia, is the source of the Blue Nile, one of the world's great rivers. Surprisingly, very little is known about the age and history of this lake: one estimate from the 1930's is that it was formed 10,000 years ago by a lava dam. Similarly, little is known about the climatic history of the wider region that comprises the Blue Nile headwaters, despite the fact that the Nile has long been recognized as critical to the resources of ancient and modern Egypt. New geophysical and core data, obtained by us in October 2003 and September 2004 with NERC support, show that the lake may be at least 40,000 years old. Our new data also show that the lake dried out at around 16,000 years ago, and almost certainly at apparently regular intervals during the later stages of the last Ice Age. It is possible that the lake dried because of intense droughts lasting one or two hundred years, and that the droughts were caused by disruption of Africa's monsoon climate when iceberg-laden meltwater from North America flooded the North Atlantic - the Heinrich events. In this new PalaeoTana Project, we aim to test these hypotheses by drilling a sediment core, up to 100m in length, from the northern basin of Lake Tana, in about 10m water depth, and about 2km from shore. The core will be scanned at high resolution using X-ray fluorescence, X-ray and colour imagery, geophysical and magnetic core-scanning technology, without damaging the sedimentary components. The resulting datasets will identify past desiccation events, which will be investigated in detail and interpreted by comparison to sediments of the known drying-out event at 16,000 years ago. Dating the sediments by appropriate methods including luminescence, tephrochronology, and Argon-Argon dating will allow precise estimates of the timing and duration of the drought events. The relative timing of these events in comparison with abrupt climatic events in ocean cores (especially Heinrich events), and in other continental records, will allow inferences about the global- scale mechanisms of abrupt climate change. The data can also be used to test climate models, and thus to help judge the accuracy of model-predicted abrupt climate change in the future. A long core record of past climate and environment from this part of Africa would have major significance for understanding both regional environmental change, because of the influence of the Nile on NE Africa and the eastern Mediterranean, and global climate. It will contribute to understanding how future changes in ocean temperature and circulation will affect global climate, especially in the heavily populated monsoon regions of Africa and Asia. It will also have significance for understanding the later stages of human evolution in and dispersal out of Africa, by providing a record of the environmental changes that influenced early human populations and their water, plant and hunting resources.