
Permeability
Type of resources
Available actions
Topics
Keywords
Contact for the resource
Provided by
Years
Formats
Representation types
Update frequencies
Scale
-
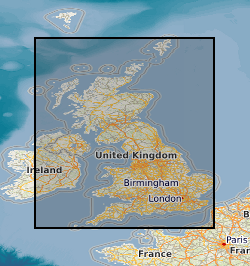
The data comprises GIS layers representing the permeability of mass movement deposits for Great Britain. The permeability data has been derived from DiGMap-GB (Digital Geological Map Data of Great Britain), and therefore reflects the scale of DiGMap-GB. For the majority of the Great Britain, the scale is 1:50,000,. The data is updated annually, or after a major new release of DiGMap-GB. The permeability data describes the fresh water flow through mass movement deposits and the ability of a unit to transmit water. Maximum and minimum permeability indices are given for each geological unit to indicate the range in permeability likely to be encountered and the predominant flow mechanism (fracture or intergranular). Neither of the assigned values takes into account the thickness of either the unsaturated or saturated part of the lithostratigraphical unit. The data can be used freely internally, but is licensed for commercial use. It is best displayed using a desktop GIS, and is available in vector format as ESRI shapefiles and MapInfo TAB files.
-

These are so-called relaxation datasets for the rate of structural relaxation of glass exposed to high temperatures. The glass is in the form of chips collected during the IDDP-1 drilling project at Krafla Iceland (more below). The chips were generated during drilling in 2011. However, the analysis presented here was developed in 2023 ahead of the ultimate publication in 2024. The data were collected using differential scanning calorimetry, which is a standard method in glass science for measuring the enthalpy of glass relaxation as it is returned to the high temperatures from which it formed. The relaxation rate of the glass from IDDP-1 tells us directly what the rate was at which it cooled. That "cooling rate" in turn allows us to understand what the time available for fragmentation and sintering in geothermal systems is, which has informed this wider project.
-

The data comprises a GIS layer representing the permeability of bedrock for Great Britain The permeability data has been derived from DiGMap-GB (Digital Geological Map Data of Great Britain), and therefore reflects the scale of DiGMap-GB. For the majority of the Great Britain, the scale is 1:50,000, however in areas where the geology is not mapped to this scale, 1:250,000 data are. The data is updated annually, or after a major new release of DiGMap-GB. The permeability data describes the fresh water flow through geological deposits and the ability of a lithostratigraphical unit to transmit water. Maximum and minimum permeability indices are given for each geological unit to indicate the range in permeability likely to be encountered and the predominant flow mechanism (fracture or intergranular). Neither of the assigned values takes into account the thickness of either the unsaturated or saturated part of the lithostratigraphical unit. The data can be used freely internally, but is licensed for commercial use. It is best displayed using a desktop GIS, and is available in vector format as ESRI shapefiles and MapInfo TAB files.
-
Data recorded during triaxial rock deformation experiments of Westerly granite in the presence of pressurised pore fluids (water). Data consists of mechanical data (load, displacement, confining pressure) and pore pressure data (up- and downstream pore pressure, upstream intensifier volume, four pore pressure transducers mounted on sample). Contains all data necessary to evaluate the results presented in the paper entitled: 'Dilatancy stabilises shear failure in rock' by Aben and Brantut, submitted to Earth and Planetary Science letters, and available at arXiv (arXiv:2101.10036).
-
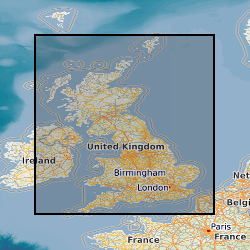
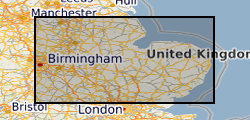
The BGS Permeability data product shows estimated rates of water movement from the ground surface to the water table. BGS Permeability version 8 incorporates the latest geology mapping (BGS Geology 50k). This includes updates to the lithology-coding schema, the LEX_RCS. A 2-part code used to identify the named rock unit from the BGS lexicon of named rock units (LEX) followed by a Rock Classification Scheme (RCS) code which describes the rocks lithological characteristics e.g. texture and composition. Updates to these codes and latest dissolution hazard data sourced from BGS GeoSure: Soluble Rocks have been reviewed and classified as part of the version 8 release. The product covers Great Britain and is presented at a scale of 1:50 000, based on the geological data at the same scale. However, in areas where the geology is not mapped to this scale, the next best available scale is used. The BGS Permeability data product can be used to compare the relative permeability of deposits at the regional scale, indicating where highly permeable rocks could allow rapid infiltration to occur, or where less permeable rocks are present and water could pond on the ground surface. The dataset can be used as a component in a wide range of geo-environmental assessments such as natural flood management, Sustainable Drainage Systems, engineering desk studies, slope stability, and aquifer vulnerability. It is for use at the regional scale and is not recommended for use at the site-specific scale.
-

The data comprises four GIS layers representing the permeability of geological deposits for Great Britain (bedrock, superficial, artificial and mass movement deposits). The permeability data has been derived from DiGMap-GB (Digital Geological Map Data of Great Britain), and therefore reflects the scale of DiGMap-GB. For the majority of the Great Britain, the scale is 1:50,000, however in areas where the geology is not mapped to this scale, the next best available scale is used. For bedrock deposits this is 1:250,000 and for superficial deposits this is 1:625:000. Artificial ground and mass movement deposits have not been mapped beyond 1:50,000. The data is updated annually, or after a major new release of DiGMap-GB. The permeability data describes the fresh water flow through geological deposits and the ability of a lithostratigraphical unit to transmit water. Maximum and minimum permeability indices are given for each geological unit to indicate the range in permeability likely to be encountered and the predominant flow mechanism (fracture or intergranular). Neither of the assigned values takes into account the thickness of either the unsaturated or saturated part of the lithostratigraphical unit. The data can be used freely internally, but is licensed for commercial use. It is best displayed using a desktop GIS, and is available in vector format as ESRI shapefiles and MapInfo TAB files.
-

The data comprises a GIS layers representing the permeability of Superficial geological deposits for Great Britain. The permeability data has been derived from DiGMap-GB (Digital Geological Map Data of Great Britain), and therefore reflects the scale of DiGMap-GB. For the majority of the Great Britain, the scale is 1:50,000, however in areas where the geology is not mapped to this scale, the next best available scale, 1:625:000, is used. The data is updated annually, or after a major new release of DiGMap-GB. The permeability data describes the fresh water flow through geological deposits and the ability of a lithostratigraphical unit to transmit water. Maximum and minimum permeability indices are given for each geological unit to indicate the range in permeability likely to be encountered and the predominant flow mechanism (fracture or intergranular). Neither of the assigned values takes into account the thickness of either the unsaturated or saturated part of the lithostratigraphical unit. The data can be used freely internally, but is licensed for commercial use. It is best displayed using a desktop GIS, and is available in vector format as ESRI shapefiles and MapInfo TAB files.
-
The data comprises GIS layers representing the permeability of artificial deposits for Great Britain. The permeability data has been derived from DiGMap-GB (Digital Geological Map Data of Great Britain), and therefore reflects the scale of DiGMap-GB. For the majority of the Great Britain, the scale is 1:50,000. The data is updated annually, or after a major new release of DiGMap-GB. The permeability data describes the fresh water flow through these deposits and the ability of a lithostratigraphical unit to transmit water. Maximum and minimum permeability indices are given for each geological unit to indicate the range in permeability likely to be encountered and the predominant flow mechanism (fracture or intergranular). Neither of the assigned values takes into account the thickness of either the unsaturated or saturated part of the lithostratigraphical unit. The data can be used freely internally, but is licensed for commercial use. It is best displayed using a desktop GIS, and is available in vector format as ESRI shapefiles and MapInfo TAB files.
-

Raw data from True Triaxial rock deformation experiment is included in TDMS and csv format. The TDMS file is the raw LabView data logging file including the time series of the experiments, loads, displacement and confining pressure. During each load step permeability measurements were made for the three loading axes. CSV files are provided for each permeability measurement, the load and axis are indicated in the file title. The TXT file includes the acoustic emission data.
-

Data for NERC grant NE/L000660/1. This is the data supporting Fig. 4 of the publication: Ebigbo, A., Lang, P. S., Paluszny, A., and Zimmerman, R. W. (2016). Inclusion-based effective medium models for the permeability of a 3D fractured rock mass. Transport In Porous Media, DOI: 10.1007/s11242-016-0685-z. It contains numerically computed permeabilities for various realisations of fracture networks. There are six different cases (as explained in the paper).