
Resistivity
Type of resources
Available actions
Topics
Keywords
Contact for the resource
Provided by
Years
Formats
Representation types
Update frequencies
Scale
-
These files contain Electric Resistivity Ground Imaging (ERGI) data measured using a Tigre 128 electric resistivity system with 64 electrodes in a roll-along survey mode. The electrodes were spaced 5 m apart and used in a Wenner a array configuration. The format of the file names is as follows: The two digits following B (18 or 20) is a label indicating the measurement site The digit following the T (1, 2 or 3) is the measurement transect number The next six digits, following the underscore, are the measurement date (ddmmyy) The next two digits, following the second underscore, are the survey number (measurements were repeated multiple times) The files are in tab delimited ascii text format, with three columns of data: Column 1 contains the distance measured across the survey transect Column 2 contains the a-spacing (the distance between adjacent electrode pairs) in m Column 3 contains the measured apparent resistivity value in Ohm m
-
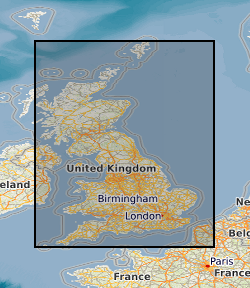
The dataset is a Soil Corrosivity Map for the U.K. based on the BGS DIGMapGB-PLUS Map. The creation of this dataset involves scoring the Soil Parent Material types for five different attributes that contribute towards the corrosion of underground assets. These are (i) high or low soil pH, (ii) general soil moisture, (iii) the likelihood that soil saturated and undergo periods of anaerobic conditions, (iv) the presence of sulphides and sulphates and (v) the resistivity of the soil parent material. The scoring of each of these parameters was undertaken based on the Cast Iron Pipe Association (CIPA) (now the Ductile Iron Pipe Research Association, DIPRA) rating system. By combining the scores of each parameter a GIS layer has been created that identifies those areas that may provide a corrosive environment to underground cast iron assets. The final map has been classified into three categories signifying: 'GROUND CONDITIONS BENEATH TOPSOIL ARE UNLIKELY TO CAUSE CORROSION OF IRON', 'GROUND CONDITIONS BENEATH TOPSOIL MAY CAUSE CORROSION TO IRON', 'GROUND CONDITIONS BENEATH TOPSOIL ARE LIKELY TO CAUSE CORROSION TO IRON'. The dataset is designed to aid engineers and planners in the management of and maintenance of underground ferrous assets.
-

A continuous four-year record of physicochemical properties of soils deglaciated in the last century due to the retreat of Midtre Lovénbreen (ML) glacier in the vicinity of Ny-Ålesund, Svalbard. Below ground data are accompanied by an over ground three-year (2022-2024) photographic record aimed at capturing snow depth levels during the transition seasons between Arctic summer and winter (NET0105681_SUNSPEARS_Photographic data). This dataset aids our understanding of deglaciated soil evolution in the current rapidly changing Arctic landscape. At four locations (reported in NET0105681_SUNSPEARS_GPS data) along the ML glacier forefield, in October 2020, soil in four different stages of development, depending on time elapsed since deglaciation, was sampled. Samples were processed in the laboratory in order to determine their texture (results reported in NET0105681_SUNSPEARS_Particle Size Analysis data) and X-ray CT scanned in order to determine their internal structure (CT reconstructed images reported in NET0105681_SUNSPEARS_Computed Tomography data). At two of the four sampling locations (SUN1 and SUN2), geophysical monitoring stations were installed, which use an array of sensors to continuously measure soil electrical resistivity in 3D (NET0105681_SUNSPEARS_PRIME 3D ERT data). Raw electrical resistivity data, instrument health data and corresponding reconstructed 3D electrical resistivity profile images (and timelapse videos) of the subsurface are included. Topographic surveys of all the sensors operated by the monitoring stations are included. In the vicinity of the two geophysical monitoring stations, longer and deeper electrical resistivity profiles were acquired. These allow one to image the boundary between the active layer (that freezes and thaws depending on ambient temperature) and underlying permanently frozen ground. Raw electrical resistivity data and corresponding reconstructed 2D electrical resistivity profile images of the subsurface are included (NET0105681_SUNSPEARS_PRIME 2D ERT data).
-

Report summarising the contents of the seismic analysis toolbox produced during the DiSECCS project. The toolbox comprises an online library of seismic software developed and utilised in the project, and presented in a form that other practitioners can utilise and tailor to their own specific needs. The toolbox include software for the measurement and characterisation of thin CO2 layers by spectral and attenuation analysis, fracture characterisation via wavelet coda analysis, novel rock physics algorithms and a summary of new laboratory analyses.
-

This dataset gathers the data collected during a brine:CO2 flow-through experiments conducted on three sandstones with similar mineralogical compositions (major minerals) but different porosity, clay-size fraction and clay mineralogy. The aim was to study the effect of such heterogeneities on interpretation of geophysical data. Geophysical and transport data were collected before, during and after exposing each sample to CO2, and analysed with basic petrophysical properties. The tests were conducted in the high-pressure, room-temperature (20°C) experimental setup for multi-flow-through tests in the Rock Physics Laboratory at the National Oceanography Centre, Southampton (NOCS), during 2022, as part of the OASIS, EHMPRES and FOCUS projects with funding from the Research Council of Norway (RCN grant no. 280472 - OASIS) and the Natural Environment Research Council (NERC grants NE/X003248/1 - FAPESP-EHMPRES, and NE/X006271/1 - FOCUS). To simulate the specific effective stress conditions of the target CO2 storage reservoir in Aurora (Aker et al., 2021), northern North Sea, the confining and pore pressure conditions of the reservoir were accommodated to our lab temperature conditions. We measured ultrasonic P- and S-wave velocities and attenuations, axial strains and electrical resistivity for an increasing CO2 saturation. The degree of brine saturation was inferred from the electrical resistivity using the modified Archie’s empirical relationship to account for the contribution of clay minerals, based on the Waxman–Smits–Juhasz model (see further details in, e.g., Falcon-Suarez et al. (2021)). We refer to Falcon-Suarez et al. (2020) for further information about the experimental rig and the CO2 injection protocol.
-

Datasets are grouped in different levels. Two main levels exist. Raw data includes processed seismic data and ERT inversion results. Seismic mass estimation relies on amplitude differences and timeshifts. ERT inversion results have been converted from VTK. • Raw *Seismic - 2009: Two datasets for Amplitude differences and Timeshifts - 2012: Two datasets for Amplitude differences and Timeshifts *ERT - 2009: One dataset with [x,y,z,Resistivity,Volume,Active] - 2012: One dataset with [x,y,z,Resistivity,Volume,Active] • Processed *Seismic - Mass_2009 - Mass_2012 * ERT - Gridded_2009 - Gridded_2012 - Seismic_ERT_Mesh_1x1 - Seismic_ERT_Mesh_1x1_CDP_Adjusted_6.25m - Seismic_ERT_Mesh_1x1_CDP_Adjusted_12.5m The dataset was created within SECURe project (Subsurface Evaluation of CCS and Unconventional Risks) - https://www.securegeoenergy.eu/. This project has received funding from the European Union’s Horizon 2020 research and innovation programme under grant agreement No 764531 (ENER/H2020/764531/SECURe).
-

The use of synthetic samples for rock physics experiments in the lab is a common practice for reservoir characterization and reservoir studies. This dataset gather ultrasonic P- and S-wave velocities and attenuations, electrical resistivity, axial and radial strains, permeability and mineralogical composition, of two synthetic and two natural sandstones, measured at variable realistic reservoir conditions of stress. The data were collected during an original study which aimed to assess the extent to which the measured properties between synthetic and natural sandstones are comparable. The work was accepted for publication in Geophysical Prospecting on the 01/10/2018, which can be accessed following the link: https://doi.org/10.1111/1365-2478.12699 Falcon-Suarez, I.H., Amalokwu, K., Robert, K., North, L., Best, A.I., Delgado-Martin, J., Callow, B., Sahoo, S.K. (accepted). Comparison of stress dependent geophysical, hydraulic and mechanical properties of synthetic and natural sandstones for reservoir characterisation and monitoring studies. Geophysical Prospecting
-

This dataset contains VASP runs performed on ARCHER to calculate the electrical and thermal conductivities of pure iron and iron alloys at Earth's core conditions using density functional theory with the Kubo-Greenwood formulation. Data are available for both the solid and the liquid phase characterising the inner and outer core respectively. Also included in the dataset the runs for computing the lattice contribution to the electrical resistivity of magnetic bcc iron at ambient pressure and two low temperatures and for computing the melting curve of fcc nickel. These data were also used for the modelling of the geodynamo and the thermal history of the Earth, to calculate the transport properties for silicon-oxygen-iron mixtures and to confirm the saturation of electrical resistivity of solid iron at Earth’s core conditions. The results from this dataset showed that both conductivities are much larger than previously thought with important implications for the geodynamo and the thermal history of the Earth, benefitting the geodynamo community. The results of our research have been recently confirmed by new experimental results obtained at Earth's core conditions. Further details can be found in Alfè et al. (2012); Pozzo et al. (2012, 2013a, 2013b, 2014, 2016); Gubbins et al. (2015); Davies et al. (2015). NERC Grant is NE/H02462X/1.
-
Here we present the dataset collected during a CO2 flow-through test using a synthetic sandstone of high porosity and permeability, originally saturated with high salinity brine, performed under realistic shallow reservoir conditions stress. During the test, we collect geophysical data (elastic and electrical properties) which record petrophysical variations in the rock related to the precipitation of salt, induced by a continuous CO2 flow through the sample.
-

The spreadsheet gathers the data collected during an experiment conducted on a Utsira Sand formation core sample to complements and constrains existing geophysical monitoring surveys at Sleipner and, more generally, improves the understanding of shallow weakly-cemented sand reservoirs. The tests were conducted in the rock physics laboratory at the National Oceanography Centre, Southampton, during 2016, as part of the DiSECCS project with funding from the United Kingdom’s Engineering and Physical Sciences Research Council (EPSRC grant EP/K035878/1) and the Natural Environment Research Council (NERC). The experiment was a steady state brine-CO2 flow-through test to simultaneously evaluate ultrasonic waves, electrical resistivity (converted into pore fluid distribution) and mechanical indicators during CO2 geosequestration in shallow weakly-cemented reservoirs. The confining and pore pressure conditions were similar to those estimated for Sleipner (North Sea – like storage reservoirs), but simulating inflation/depletion cyclic scenarios for increasing brine:CO2 fractional flow rates. The data include primary ultrasonic wave velocities and attenuation factors, axial and radial strains, and electrical resistivity. Also, we provide a velocity-saturation relationship of practical importance to CO2 plume monitoring, obtained from the inversion of ultrasonic velocity and attenuation data and extrapolation of results to field-scale seismic-frequencies using a new rock physics theory. The dataset is linked to this publication: http://www.sciencedirect.com/science/article/pii/S1750583617306370.