
Simulation
Type of resources
Available actions
Topics
Keywords
Contact for the resource
Provided by
Years
Formats
Representation types
Update frequencies
-
Numerical models of mass flows and tsunamis that they generated with their entrance in the sea. The mass flows propagate in the Sciara del Fuoco of Stromboli. The mass flows are not real events, but are rather used as a sensitivity analysis to examine tsunamigenic potential of mass flows of landslides and pyroclastic flows of different durations, volumes and coherence. The data was generated with the two fluid version of the Volcflow model. The material includes tsunami height measurements (plotted as well as raw data) for each run recorded by virtual gauges located around the island (map of gauges included), maximum wave height data in the area around the island and at the shores, a video visualisation of the mass flows and resultant tsunami waves, and a figure of the final deposit from each modelled mass flow. The numerical model simulations were carried out by Symeon Makris. The Volcflow code is not included in the submitted material but it is open source and can be downloaded here: https://lmv.uca.fr/volcflow/
-
The folders contain the inputs required to run numerical simulations of the Anak Krakatau eruption in 2018, including ERA wind field data, and model input files (.bak). Two sets of simulations were used. The first set of simulations were inversions (see inversion file), which allows input parameters to be estimated through application of numerical model to observations. Multiple inversions were used accounting for different amounts of water entrained at the source (Fractions of 0 - 0.25 in 0.05 intervals). The best fit input parameters were used to run the forward model (see ForwardModel folder), and the results were compared to asses those most representative of observed eruption dynamics (Sim6).
-

This dataset contains data from two publications investigating mackinawite FeS in an aqueous environment. The first includes the derivation and validation of the force field parameters necessary to model the system (http://link.springer.com/article/10.1007/s00214-015-1782-8). In the second publication, the force field is employed to predict the structural and dynamical properties of water at the interface with the (001) surface of mackinawite (http://scitation.aip.org/content/aip/journal/jcp/144/9/10.1063/1.4942755).
-
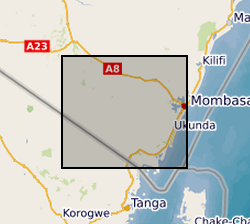
The download .rar file contains a groundwater model of the coastal aquifer in Kwale County, Kenya (ModelMuse Text File) produced by Dr Nuria Ferrer and Dr Albert Folch at the Universitat Politècnica de Catalunya. The model can be used to explore future climate and groundwater abstraction scenarios to provide management recommendations. The download does not include proprietary abstraction data from industry project partners, thus running the model provided here will not reproduce published research findings. The file named”np67IH.bhd” are the initial heads file required to run the model.
-

The two earthquake scenario narratives are communications tools created to engage the local population and policy makers in Weinan city. They will be uploaded on the Overseas Development Institute website and be publicly accessible.
-

A Multiphysics model for a molten carbonate fuel cell (MCFC) developed in COMSOL. This is a multiphysics model for a MCFC. It has been built using COMSOL Multiphysics®. It enables the user to investigate the composition of the fuel and flue gases as well as the design parameters (e.g. the thickness of the electrolyte) on the performance of the fuel cell and the efficiency of CO2 capture. For example, the impact of CO2 concentration in the flue gas on the fuel cell performance and the carbon capture factor (which is a measure on how much CO2 has been concentrated from the flue gas) could be evaluated. One of the key findings show that the fuel cell performance improves and the carbon capture factor decreases with increasing CO2 in the flue gas. A process model for liquid fuel production through reverse water gas shift (RWGS) and Fischer-Tropsch (FT) developed in Aspen Plus. The model enables the user to examine the production of liquid fuels through CO2 hydrogenation followed by FT synthesis. The user can test different conditions for the RWGS such as H2/CO2 ratio and temperature and investigate how these changes affect the CO2 conversion. The product distribution for the FT follows the Anderson–Schulz–Flory (ASF) distribution. The ASF model is applied in a FORTRAN calculator and assumes a chain growth probability factor (α) of 0.9; the user may change the value of α and investigate how this affects the product distribution. A CO2 compression model developed in Aspen Plus. The model liquefies the captured CO2 stream through multistage compression with intermediate cooling and water condensation/removal. UKCCSRC Flexible Funds 2020.
-
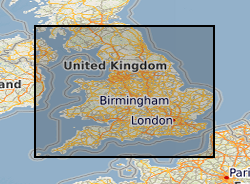
The Environment Agency has updated its groundwater vulnerability map to reflect improvements in data mapping, modelling capability and understanding of the factors affecting vulnerability. Two new maps are available which show the vulnerability of groundwater to a pollutant discharged at ground level. The potential impact of groundwater pollution is considered using the aquifer designation status which provides an indication of the scale and importance of groundwater for potable water supply and/or in supporting baseflow to rivers, lakes and wetlands. This dataset has shared IP (Intellectual Property) between Environment Agency and British Geological Survey. It supersedes the previous Groundwater Vulnerability 100k data released by EA.
-

2 examples of Integrated Water Vapour Transport (IVT) maps generated using a new algorithm produced from the work done under the Grant. This algorithm has been published and the article can be found here: http://onlinelibrary.wiley.com/doi/10.1029/2012JD018027/abstract
-

Coordinated by Haroun Mahgerefteh at UCL, the EC funded FP7 CO2QUEST project addressed the main challenges associated with determining the optimal composition and purity of CO2 product streams derived from carbon capture systems for enabling its safe and economic transport and storage. The project brought together academics and major stakeholders to perform computational studies backed-up by large-scale experiments aimed at identifying CO2 mixtures that have the most profound impact on the different parts of the CCS chain. The project ran from March 2013 until June 2016, involving 9 partners across Europe, including from Canada and China. It resulted in over 100 peer reviewed journal publications and conference proceedings, three international conferences and several newsletters, receiving the IChemE Highly Commended Global Process Safety Award in 2016. More information about CO2QUEST including its objectives, deliverables and list of publications may be found at: http://www.co2quest.eu/
-

This dataset comprises X-ray tomography image stacks, label files, and vector matrices containing 3D location coordinates of velocity distributions derived from permeability simulations for igneous mushy samples. The X-ray tomography images have spatial resolutions ranging from 3.5 to 56 µm, providing detailed 3D representations of the rock samples. The data were collected with samples from four distinct locations: Brandur (Iceland), Avellino (Italy), K?lauea Iki (Hawaii, USA), and Saint Kitts (St. Kitts and Nevis). Additionally, the dataset includes electron microprobe analyses of plagioclase and amphibole minerals from Saint Kitts. The primary purpose of this dataset is to support research into volcanic processes, rock sample analysis, and permeability simulations in igneous cumulate and plutonic rocks. It is particularly useful for geologists, volcanologists, and researchers in material science and structural geology. Each sample in the dataset is organised into a dedicated folder containing the following X-ray tomography image stacks (in a separate folder named as the sample), label files (.am files named using the sample name as a prefix), binary images of the connected plutonic matrices (.am files with the suffix “Axis-Connectivity”), vector matrices with 3D location coordinates (“PotentialZ” for the pressure field, “VelocityZ” for the velocity field), a DOCX file with the metadata for the sample such as voxel size and the number of layers for each label, and, where applicable, a subfolder with SEM images.