 NERC Data Catalogue Service
Geological surveys
Type of resources
Topics
Keywords
Contact for the resource
Provided by
Years
Formats
Representation types
Update frequencies
Scale
-

The BGS collection of 1:10 560 / 1:10 000 National Grid Series geological maps. These maps are based on the Ordnance Survey National Grid series of maps, which are defined by the 10 km intervals of the larger 100 km square identified by a specific two-letter code. Each map is thus denoted by a unique reference, e.g. SP 29 NW. SP=100 km square; 29=10 km square; NW=5 km square. Since field mapping is generally undertaken at the scale of 1:10 000 (or equivalent), these maps are the largest-scale main series of geological maps that BGS holds. A small number of remote areas were mapped at 1:25 000 scale, the subsequent maps are also at 1:25 000 scale and are included in this series. The equivalent to the National Grid Series prior to the 1960s is the County Series (at 1:10 560 scale). In the 1960s, this series started to be replaced by 6 inches to 1 mile (1:10 560 scale) National Grid sheets based on the four quadrants (NW, NE, SW, SE) of a 10 km Ordnance Survey National Grid square. Areal coverage provided by the National Grid series of large-scale maps is limited in extent and the preceding County series of six-inch maps can still be the most up to date map available for some areas. Geological maps represent a geologist's compiled interpretation of the geology of an area. A geologist will consider the data available at the time, including measurements and observations collected during field campaigns, as well as their knowledge of geological processes and the geological context to create a model of the geology of an area. This model is then fitted to a topographic basemap and drawn up at the appropriate scale, with generalization if necessary, to create a geological map, which is a representation of the geological model. Explanatory notes and vertical and horizontal cross sections may be published with the map. Geological maps may be created to show various aspects of the geology, or themes. The most common map themes held by BGS are solid (later referred to as bedrock) and drift (later referred to as superficial). These maps are, for the most part, hard-copy paper records stored in the National Geoscience Data Centre (NGDC) and are delivered as digital scans through the BGS website.
-

For much of the Geological Survey's existence, the County Series of maps were the standard large-scale maps on which geological mapping was undertaken. These maps are based on the Ordnance Survey County (or six-inch to the mile) series of maps. These maps were cut up to be used in the field to record geological observations, and on return to the office, the geology was transferred to a complete County Series map, which after approval was known as a 'standard' (England / Wales) or 'clean copy' (Scotland). This dataset contains the 'standard' or 'clean copy' County Series maps held by BGS. Geological maps represent a geologist's compiled interpretation of the geology of an area. A geologist will consider the data available at the time, including measurements and observations collected during field campaigns, as well as their knowledge of geological processes and the geological context to create a model of the geology of an area. This model is then fitted to a topographic basemap and drawn up at the appropriate scale, with generalization if necessary, to create a geological map, which is a representation of the geological model. Explanatory notes and vertical and horizontal cross sections may be published with the map. Geological maps may be created to show various aspects of the geology, or themes. The most common map themes held by BGS are solid (later referred to as bedrock) and drift (later referred to as superficial). These maps are hard-copy paper records stored in the National Geoscience Data Centre (NGDC) and are delivered as digital scans through the BGS website.
-

A series of maps at the detailed scale of 1:25 000 have been produced for areas of outstanding geological interest in Great Britain. Some maps are accompanied by explanatory booklets. The maps were published between 1954 and 2007. About 60 maps have been published, some showing solid geology, some drift geology and some combined solid and drift. Most of the maps include geological cross sections and generalised vertical sections. Geological maps represent a geologist's compiled interpretation of the geology of an area. A geologist will consider the data available at the time, including measurements and observations collected during field campaigns, as well as their knowledge of geological processes and the geological context to create a model of the geology of an area. This model is then fitted to a topographic basemap and drawn up at the appropriate scale, with generalization if necessary, to create a geological map, which is a representation of the geological model. Explanatory notes and vertical and horizontal cross sections may be published with the map. Geological maps may be created to show various aspects of the geology, or themes. These maps are hard-copy paper records stored in the National Geoscience Data Centre (NGDC) and are delivered as digital scans through the BGS website.
-

The 1:63 360 / 1:50 000 scale map series are the most useful scale for most purposes. They provide almost complete coverage of onshore Great Britain. The BGS collection of 1:63 360 and 1:50 000 scale maps comprises two map series: - Geological Survey of England and Wales 1:63 360 / 1:50 000 Geological Map Series [New Series]. These maps are based on the Ordnance Survey One-inch New Series topographic basemaps and provide almost complete coverage of England and Wales, with the exception of sheet 180 (Knighton). The quarter-sheets of 1:63 360 Old Series sheets 91 to 110 coincide with sheets 1 to 73 of the New Series maps. These earlier maps often carry two sheet numbers which refer to the Old Series and the New Series. - Geological Survey of Scotland 1:63 360 / 1:50 000 Geological Map Series. These maps are based on the Ordnance Survey First, Second, Third and Fourth editions of the One-inch map of Scotland. The maps used the most recent topographic basemap available at the time. In the Western Isles, one-inch mapping was abandoned and replaced by maps at 1:100 000 scale, which are associated with this series. Sheets were traditionally issued at 1:63 360 scale, with the first 1:50 000 maps appearing in 1972. Sheets at 1:50 000 scale may be either facsimile enlargements of an existing 1:63 360 sheets, or may contain new geology and cartography. The latter bear the additional series designation '1:50 000 series'. Within the Scottish series, new mapping at 1:50 000 scale was split into east and west sheets. For example, the original one-inch sheet 32 became 1:50 000 sheets 32E and 32W. A number of irregular sheets were also introduced with the new 1:50 000 scale mapping. There are a number of irregular special sheets within both series. Geological maps represent a geologist's compiled interpretation of the geology of an area. A geologist will consider the data available at the time, including measurements and observations collected during field campaigns, as well as their knowledge of geological processes and the geological context to create a model of the geology of an area. This model is then fitted to a topographic basemap and drawn up at the appropriate scale, with generalization if necessary, to create a geological map, which is a representation of the geological model. Explanatory notes and vertical and horizontal cross sections may be published with the map. Geological maps may be created to show various aspects of the geology, or themes. The most common map themes held by BGS are solid (later referred to as bedrock) and drift (later referred to as superficial). These maps are, for the most part, hard-copy paper records stored in the National Geoscience Data Centre (NGDC) and are delivered as digital scans through the BGS website.
-

The UTM series of maps are based on 1:250 000 base maps published by the Ordnance Survey. Mapping is divided into squares which cover 1 degree by 1 degree of latitude / longitude in the Universal Transverse Mercator (UTM) projection, and coverage extends offshore and onto the continental shelf. The UTM series are available in three different themes: - Solid geology (complete coverage within the mapped area, including most of the UK continental shelf) - Sea bed sediments (coverage for most offshore areas) - Quaternary geology (coverage for the UK sector of the North Sea, Irish Sea and the Atlantic margin) Also included within this series are two small-scale (1:500 000) bedrock geology maps of the Central Rockall Basin and North Rockall Basin. These maps supersede the older quarter-inch series of maps which were published for England / Wales and Scotland. Geological maps represent a geologist's compiled interpretation of the geology of an area. A geologist will consider the data available at the time, including measurements and observations collected during field campaigns, as well as their knowledge of geological processes and the geological context to create a model of the geology of an area. This model is then fitted to a topographic basemap and drawn up at the appropriate scale, with generalization if necessary, to create a geological map, which is a representation of the geological model. Explanatory notes and vertical and horizontal cross sections may be published with the map. These maps are, for the most part, hard-copy paper records stored in the National Geoscience Data Centre (NGDC) and are delivered as digital scans through the BGS website.
-

The 3D multi channel seismic data were acquired as part of a collaborative investigation into models of magmatic segmentation between the Scripps Institute of Oceanography and BIRPS (the British Institutions Reflection Profiling Syndicate). The 3D EPR (East Pacific Rise) ARAD (Anatomy of a Ridge Axis Discontinuity) EW9707 cruise was undertaken in September and October 1997 to provide both refelction and wide-angle seismic data for the study of the overlapping spreading centre (OSC) at 9 degrees 3 minutes N on the East Pacific Rise. The data were acquired with a single source and a single streamer with a nominal line spacing of 100 m. The 3D-EPR ARAD survey was a joint NERC/NSF (US National Science Foundation) funded project and the copyright for this survey is held jointly. Reference: Bazin, S. Harding, AJ. et al. (2001) Three-dimensional shallow crustal emplacement at the 9 degree 03 minute N overlapping spreading center on the East Pacific Rise, Journal of Geophysical Research.
-
The British Geological Survey has collected over 50000 offshore samples using grabs, dredges and shallow coring devices (to a maximum depth of 6m below the sea bed). The collection also includes additional third party data and has assisted in the creation of BGS Marine Geology Maps. The distribution is variable, but in general there are sample stations spaced about every 5 - 10km across the entire UK Continental Shelf (UKCS). In some localised areas the sampling density is much higher. The data held includes digital data and analogue records (sample data sheets), plus associated physical sample material. Sample data sheets which have been scanned contain index information and geological descriptions and are more detailed from 1983 onwards. Coded geological descriptions were entered on sheets which were subsequently digitised, and this information is available for about 10,000 samples. The data also includes results of analyses such as micropalaeontological examination or age dating. Particle Size Analysis, geochemistry and geotechnical data are described in separate metadata entries. Sample material are managed as part of the BGS Materials collection and are available for examination and subsampling. The data are stored within the National Geoscience Data Centre (NGDC) and Marine Environmental Data and Information Network (MEDIN) Data Archive Centre (DAC) for Geology and Geophysics. Data are delivered via the BGS Offshore GeoIndex www.bgs.ac.uk/GeoIndex/offshore.htm.The activity and scan layers contains location information, metadata and links to scanned sample datasheets/core logs, and the geological, geotechnical, geochemical and sea-bed sediment data layers contain observations and/or measurements as digital values. The data are applicable to a wide range of uses including environmental, geotechnical and geological studies. Reference: Fannin, NGT. (1989) Offshore Investigations 1966-87. British Geological Survey Technical Report WB/89/2, British Geological Survey.
-
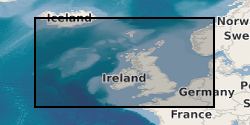
The British Institutions Reflection Profiling Syndicate (BIRPS) shot approximately 12,000 km of deep, multi-channel seismic reflection data around the British Isles from 1981 to 1991 during 14 surveys. Recording depths vary depending on the purpose of the survey but range from 15 s to 40 s two-way time. Raw and processed digital data are archived by BGS who make the data available subject to the cost of reproduction and handling. Seismic sections and other analogue ancillary data are available for some surveys. Gravity and magnetic data may also be available.
-
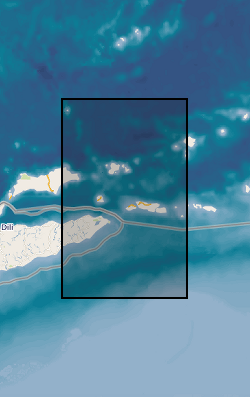
In 1992, BIRPS joined with the Indonesian Marine Geological Institute to record two long multichannel normal-incidence reflection profiles, one of which is DAMAR, the other TIMOR, and one short profile (API) close to the volcano Gunung Api. The survey provides a modern analogue to tectonics hypothesized to have occurred across the Iapetus suture zone of northern England 450-400 Ma. The Banda Arc of Indonesia near the island of Timor is widely recognized as the premier example of the active subduction of continental crust and lithosphere beneath oceanic lithosphere. The crossing of a modern island arc and close passage to active volcanoes was intended to image reflections associated with magma in the crust and uppermost mantle.
-

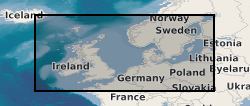
MONA LISA (Marine and Onshore North Sea Acquisition for Lithospheric Seismic Analysis) seismic data was acquired by BIRPS (the British Institutions Reflection Profiling Syndicate) across the Ringkobing-Fyn High of the central North Sea were designed to study the crust near a hypothesized Caledonian age triple junction associated with the colliding continental crust of Laurentia, Avalonia (Gondwanaland) and Baltica. The specific target was the eastward continuation of the Caledonian Front (Iapetus Suture), as previously recognised on NEC (North East Coast line), MOBIL (Measurements over Basins to Image Lithosphere), NSDP (North Sea Deep Profile) and BABEL (Baltic and Bothnian Echoes from the Lithosphere) profiles, in northern Europe. 1112 km of data were acquired, recorded to 26 s two-way time.