
Faults
Type of resources
Available actions
Topics
Keywords
Contact for the resource
Provided by
Years
Formats
Representation types
Update frequencies
Service types
Scale
-

Multiple calibrated laboratory images of experiments to determine leakage rates through faults and geological heterogeneities. Two sequences of images, and associated movie (avi file) depicting laboratory fault experiments as described in; Gilmore, K., Sahu, C., Benham, G., Neufeld, J., & Bickle, M. (2022). Leakage dynamics of fault zones: Experimental and analytical study with application to CO2 storage. Journal of Fluid Mechanics, 931, A31. doi:10.1017/jfm.2021.970
-
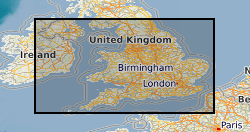
The data comprises information on the subsurface structure of stratigraphic levels and units in the United Kingdom, detailing depth to and thickness of the units. These result from projects in different parts of the UK performed at different times. Common working scales are 1:50 000 and 1:250 000 with appropriate differences in detail. Much mapping results from interpretation of seismic data, and as a result many of the structural maps are in time rather than depth, although some have been depth converted.
-

This vector dataset compiles the vertical and non-vertical faults for the top and base of the Sherwood Sandstone Group in the Permo-Triassic Worcester, Wessex, East Yorkshire Lincolnshire and Cheshire basins.
-
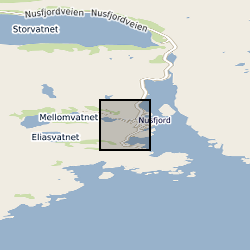
The database contains field measurements and field descriptions of pseudotachylytes and mylonites that formed at lower crustal conditions and that are now exposed on the Nusfjord ridge, Lofoten, northern Norway. The field measurements were used to derive earthquake source parameters associated with the generation of the Nusfjord pseudotachylytes.
-

This vector dataset compiles the vertical and non-vertical faults for the Permian hot sedimentary aquifers in the Cheshire (Collyhurst Sandstone Formation, CS) and the Worcester (Bridgnorth Sandstone Formation, BS) basins.
-

This vector dataset compiles the faults for the Upper Devonian in hot sedimentary aquifers in the Midland Valley of Scotland, UK used by Kearsey, T.I., Receveur, M. and Monaghan, A.A., 2024. Modelled hot sedimentary aquifer geothermal potential of Upper Devonian strata in the Midland Valley of Scotland.
-
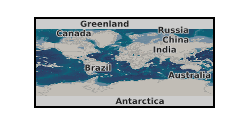
Whole rock geochemical data from the Alpine Fault Zone. These data have been generated from systematic sampling through the Deep Fault Drilling Project - Phase 1 rock cores and from analyses of cuttings retrieved during the Deep Fault Drilling Project - Phase 2. Geochemical analyses on the fault rocks to understand the conditions at which they were deformed. The dataset is associated with the UK component of a major international campaign, the Deep Fault Drilling Project (DFDP). to drill a series of holes into the Alpine Fault, New Zealand. The overarching aim of the DFDP to understand better the processes that lead to major earthquakes by taking cores and observing a major continental fault during its build up to a large seismic event.
-

Structural geology data obtained by Land Survey staff during their mapping work. Originally designed for the Mid-Wales Mapping Programme but subsequently used by other teams. Holds details of planar structures, linear structures, folds, faults and veins.
-
Interpretations of fault positions, geometries and displacements, and seismic stratigraphic horizons. These are provided in the form of Seismic fault and horizon data as ‘Charisma fault sticks’ and ‘Charisma 2D interpretation lines’ ASCII files, respectively, exported from Petrel 2019. Additional CSV and XLSX files containing the compiled coordinate data are included. A readme file is also included explaining the contents of the different files and folders. Interpretations are from seismic profiles of the input oceanic plate section to the North Sumatra subduction zone. Results are published in: Stevens, D.E., McNeill, L.C., Henstock, T.J., Delescluse, M., Chamot-Rooke, N., Bull, J.M., 2020, Intraplate deformation offshore North Sumatra: New Insights from integration of IODP Expedition 362 results with seismic data. EPSL, 538, 116218.
-

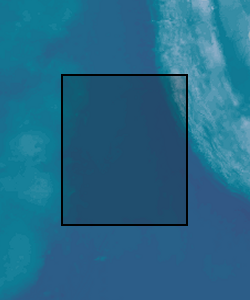
There are two components to this dataset: (1) fault analyses used to estimate underlying dyke properties, imaged in 3D seismic reflection data; and (2) dimension measurements and calculations of pit craters associated with the dykes and faults. This dataset specifically supplements https://webapps.bgs.ac.uk/services/ngdc/accessions/index.html#item170389. The seismic reflection data are located offshore NW Australia and image a series of Late Jurassic dykes and overlying dyke-induced normal faults; these structures occur within a sedimentary basin and are now buried beneath several kilometres of rock. The specific seismic reflection dataset used for this study so far is the Chandon 3D survey, which is available through https://www.ga.gov.au/nopims and is also deposited within the NGDC. Dyke-induced faults: Analyses of these faults uses an array of point pairs, defined by X, Y, and Z co-ordinates, that mark where certain sedimentary beds are intersected by the fault in its footwall and hanging wall. Mapping of these points for 11-14 sedimentary horizons was conducted using Petrel seismic interpretation software. From the footwall and hanging wall point pairs, the throw, heave, displacement, and dip of each fault was calculated. By measuring distances between corresponding point pairs on opposing faults, graben width properties and estimated down-dip fault continuations were calculated. The expression of dyke-induced faults observed at the surface in active volcanic areas is often used to estimate dyke location, thickness (expected to roughly equal the heave on overlying faults), and upper tip depth (expected to occur where overlying, oppositely dipping faults meet; i.e. the point of the ‘V’). This study represents the first time natural dyke-induced faults and underlying dykes have been imaged in 3D and quantitatively studied. The dataset presented here allows hypotheses concerning relationships between dyke-induced fault geometries and dyke properties to finally be tested, and provides insight into normal fault kinematics; this will be useful to structural geologists and volcanologists. Pit craters: These features are enigmatic, quasi-circular depressions that commonly occur at the surface above inferred dykes and faults. The long axis and short axis lengths, as well as the area and depression depth, of the pit crater plan-view morphologies were measured. 3D seismic reflection data reveal the pit craters are underlain by pipes, for which the height, diameter, and volumes are calculated. These pipes often connect to dykes and faults, providing the first conclusive evidence that dyking and faulting mechanisms can drive pit crater formation. However, although studies of pit craters on other planets has used their surface shape to predict subsurface processes and geology, the data presented here suggest pit crater surface expressions are not diagnostic of formation mechanisms or geology.