 NERC Data Catalogue Service
University of Hull
Type of resources
Topics
Keywords
Contact for the resource
Provided by
Years
Formats
Representation types
Update frequencies
Resolution
-
The emission of carbon dioxide into the atmosphere has caused huge concerns around the world, in particular because it is widely believed that the increase in its concentration in the atmosphere is a key driver of climate change. If the current trend in the release of carbon dioxide continues, global temperatures are predicted to increase by more than 4 degrees centigrade, which would be disastrous for the world. With the increase in world population, the energy demand is also increasing. Coal-fired and gas-fired power plants still play a central role in meeting this energy demand for the foreseeable future, even though the share of renewable energy is increasing. These power plants are the largest stationary sources of carbon dioxide. Carbon capture is a technique to capture the carbon dioxide that is emitted in the flue gas from these power plants. This proposal seeks to make a significant improvement in the methods used for carbon capture in order to reduce the total costs. Post-combustion CO2 capture by chemical absorption using solvents (for example, monoethanolamine - MEA) is one of the most mature technologies. The conventional technology uses large packed columns. The cost to build and run the capture plants for power plants is currently very high because: (1) the packed columns are very large in size; (2) the amount of steam consumed to regenerate solvents for recirculation is significant. If we can manage to reduce the size of packed columns and the steam consumption, then the cost of carbon capture will be reduced correspondingly. From our previous studies, we found that mass transfer in the conventional packed columns used for carbon capture is very poor. This proposed research is expected to make very significant improvements in mass transfer. The key idea is to rotate the packed column so that it spins at hundreds of times per minute - a so-called rotating packed bed (RPB). A better mass transfer will be generated inside the RPB due to higher contact area. With an intensified capture process, a higher concentration of solvent can be used (for example 70 wt% MEA) and the quantity of recirculating solvent between intensified absorber and stripper will be reduced to around 40%. Our initial analysis has been published in an international leading journal and it indicates that the packing volume in an RPB will be less than 10% of an equivalent conventional packed column. This proposal will investigate how to design and operate the RPB in order to separate carbon dioxide most efficiently from flue gas. The work will include design of new experimental rigs, experimental study, process modelling and simulation, system integration, scale-up of intensified absorber and stripper, process optimisation, comparison between intensified capture process and conventional capture process from technical, economical and environmental points of view. The research will include an investigation into the optimum flow directions for the solvent and flue gas stream (parallel flow or counter-current) for intensified absorber and the optimum design of packing inside the RPB. The proposal will also compare the whole system performance using process intensification vs using conventional packed column for a CCGT power plant. Based on this, an economic analysis will be carried out to quantify the savings provided by this new process intensification technology. Grant number: EP/M001458/1.
-

This presentation on the EPSRC project, Process Intensification for Post-combustion Carbon Capture using Rotating Packed Bed through Systems Engineering Techniques, was presented at the Cranfield Biannual, 21.04.15. Grant number: EP/M001458/1.
-
This dataset contains the elevation data of a 10m long, 20cm wide experimental river. This river was generated in an experimental flume (Total Environment Simulator) of the University of Hull. This river was formed spontaneously by imposing water and sediment flux at the upstream boundary of a flat sand bed. This model doesn’t attempt to reproduce any natural river, it’s a generic model design to explore the influence of discharge variation on the river evolution. We regularly measure the topography of the experimental area to follow the evolution of the river width, depth, slope, and conveyance capacity. The elevation is measured in metres. The associated table contains the experimental characteristics: time (seconds), water discharge (L/min), and morphological characteristics extracted from the DEM. This is the raw data, so the width is in pixels, the depth is in metres and the conveyance capacity is in metre pixel. Full details about this nonGeographicDataset can be found at https://doi.org/10.5285/7b2071d6-da02-4f48-a87e-ccab19a737bd
-
This dataset contains data that are meant to be used in conjunction with the “Digital Elevation Model of an experimental river generated in a flume under variable discharge conditions” dataset. There are three data files. The Sed_fluxes.csv file contains mass balance information i.e., the sediment flux injected in the channel and that collected at the outlet. The other two files detail the evolution of the channel morphology before and after each of the experimental flood events. Full details about this nonGeographicDataset can be found at https://doi.org/10.5285/9457cd25-b8d6-4319-8e75-e9fdc7a171ab
-
This dataset describes hourly time series of discharge and suspended sediment flux at four sites in the Vietnamese Mekong Delta (Chau Doc, Tan Chau, Can Tho and My Thaun) for the period 2005 – 2015. This data was calculated from historic Acoustic Doppler Current Profiler (aDcp)data obtained as part of routine flood monitoring conducted by the Vietnamese Hydrological Agency. The data were collated by the authors. The data were processed to back out sediment fluxes through the delta through calibration of the acoustic backscatter signal to suspended sediment concentrations collected in Chau Doc (May 2017) and Can Tho (September 2017). For each aDcp instrument acoustic backscatter signal was calibrated to observed suspended sediment concentrations (SSCs). These concentrations values were then matched to measured acoustic backscatter values (dB) from the depth at which each sample was taken to generate power law calibration curves. To generate daily fluxes, the point specific ADCP fluxes were used to generate sediment ratings curves between sediment flux (kg/s) and discharge (m3/s). These ratings curves were then propagated over recorded daily discharge values measured by the Vietnamese hydrological agency to provide daily fluxes over the period of record. The work was funded through NERC grant reference NE/P008100/1 - Deciphering the dominant drivers of contemporary relative sea-level change: Analysing sediment deposition and subsidence in a vulnerable mega-delta. Full details about this dataset can be found at https://doi.org/10.5285/ac5b28ca-e087-4aec-974a-5a9f84b06595
-
These files contain Electric Resistivity Ground Imaging (ERGI) data measured using a Tigre 128 electric resistivity system with 64 electrodes in a roll-along survey mode. The electrodes were spaced 5 m apart and used in a Wenner a array configuration. The format of the file names is as follows: The two digits following B (18 or 20) is a label indicating the measurement site The digit following the T (1, 2 or 3) is the measurement transect number The next six digits, following the underscore, are the measurement date (ddmmyy) The next two digits, following the second underscore, are the survey number (measurements were repeated multiple times) The files are in tab delimited ascii text format, with three columns of data: Column 1 contains the distance measured across the survey transect Column 2 contains the a-spacing (the distance between adjacent electrode pairs) in m Column 3 contains the measured apparent resistivity value in Ohm m
-
This dataset contains a time series of species-specific fish abundances and covariates for 1180 fish sites in English rivers. Sites with at least ten annual fish surveys in the Environment Agency’s (EA) National Fish Population Database (NFPD) between 1975 and 2017 inclusive were selected. Covariate data include habitat quality indicators (River Habitat Survey and HABSCORE outputs), climatic variables (Gulf Stream and North Atlantic Oscillation indices), land-use change, river hydrology, water temperature, effluent dilution factor and concentrations of chemical determinands. The work was supported by the Natural Environment Research Council (Grant NE/S000100/2). Full details about this dataset can be found at https://doi.org/10.5285/b0afb78e-a0cb-4762-9220-659211ae3a5e
-
[This dataset is embargoed until August 31, 2025]. This dataset contains monthly/annual time series of species-specific abundances and covariates for 137 targeted larval/juvenile fish surveys at sites in a range of English lowland rivers. Larval/juvenile fish data come from two different sources: The Environment Agency’s (EA) National Fish Population Database (NFPD) between 1974 and 2017 and a dataset created by the University of Hull (UoH) between 1984 and 2017 inclusive. Biological data consists of density estimates of each fish species from each survey (per metre squared) and also the average length of specified species at the end of their first year of growth. Covariate data include habitat quality indicator (River Habitat Survey), climatic variables (Gulf Stream and North Atlantic Oscillation indices), land-use change, river hydrology, water temperature, effluent dilution factor and concentrations of chemical determinands. This dataset was created as larvae and juveniles may be particularly useful indicators and respond differently than older fish to environmental stressors. The work was supported by the Natural Environment Research Council (Grant NE/S000100/2). Full details about this dataset can be found at https://doi.org/10.5285/c904c5f0-7f21-4759-a7d4-c262da230b53
-

Field and microstructural analysis of pseudotachylytes formed at lower crustal depths and now lying exposed in the Flakstadøy Anorthosite, Lofoten, Norway. Electron backscatter diffraction (EBSD) analysis : 10 EBSD datasets (cpr files) - unfiltered. These characterise deformation in pyroxenes spatially associated with pseudotachylyte faults in the Nusfjord anorthosite. Grain size analysis - backscattered electron (BSE) images and processed equivalents (segmented manually or with ImageJ software) of fragmented orthopyroxene for grain size analysis. Results are processed in the spreadsheet 'Grain size distributions for fragmented OPX'. Samples involved: LC1724 and N22 Grain growth modelling - spreadsheet calculating grain growth rates for orthopyroxene in samples LC1724 and N22 Strain analysis - used to estimate strain via clast analysis of mylonitised pseudotachylyte, sample 269c
-

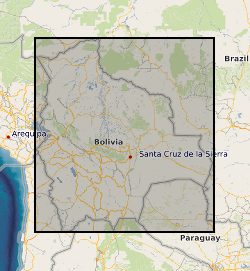
Each contains two columns of data representing the UTM coordinates of the centre line of the Rio Beni in Bolivia. These coordinates were derived by digitising Landsat imagery and aerial photographs (1960 only). The number in the file name after "banks_c" corresponds to the year. Numbers in column 1: UTM Zone 19S Easting Numbers in column 2: UTM Zone 19S Northing