Paper Map
Type of resources
Topics
Keywords
Contact for the resource
Provided by
Years
Formats
Representation types
Update frequencies
Scale
-
These are OS 1:25000 paper maps (approximately 1400) upon which the Ministry of Housing and Local Government (currently Department for Communities and Local Government (CLG)) recorded hand drawn boundaries for permitted, withdrawn and refused mineral planning permissions and worked ground for every local authority area in England. Accompanying the maps is an associated card index (see metadata for MHLG Cards). Priority was placed on areas that were given rise to then current casework issues thus, at the time when the maintenance of the maps ended some authority information had been updated recently but other areas had not been visited for many years. Therefore, the variable completeness of the data should be kept in mind when the material is being used. Both the maps and the card index have been used to create the digital mineral planning permissions polygons (see metadata for MHLG Planning Permission Polygons). Polygons for worked ground have not been captured.
-
Digital GIS mineral planning permission polygons from 1947 to 1985 as digitised from the Ministry of Housing and Local Government Planning Permission Maps and Cards (see associated metadata for MHLG Maps, Cards and Scanned Maps ). Data digitised included all planning permissions granted, withdrawn and refused for local authority areas for all of England. Currently 32,000 separate planning permission polygons have been captured from the maps and attributed using the associated card index.
-
The map show the broad distribution of the industrial, including construction, mineral resources of Britain and the main sites where these are worked. Over extensive areas bedrock is covered by superficial deposits, including economically important sand and gravel resources. These superficial deposits are not shown on the map. Resources have been defined by dominant lithology (rock type). The map is a synthesis of the mineral resources and mineral working data held by the BGS in 1996. The published (paper) map has not been superseded however the digital mineral resources and mineral workings data has since been superseded. The map is logically consistent throughout.
-
This mineral resource data was produced as part of the Mineral Resource Map of Northern Ireland via a commission from the Northern Ireland Department of the Environment. The work resulted in a series of 21 data layers which were used to generate a series of six digitally generated maps. This work was completed in 2012 with one map for each of the six counties (including county boroughs) of Northern Ireland at a scale of 1:100 000. This data and the accompanying maps are intended to assist strategic decision making in respect of mineral extraction and the protection of important mineral resources against sterilisation. They bring together a wide range of information, much of which is scattered and not always available in a convenient form. The data has been produced by the collation and interpretation of mineral resource data principally held by the Geological Survey of Northern Ireland and was funded via a commission from the Northern Ireland Department of the Environment. These layers display the spatial data of the mineral resources of Northern Ireland. There are a series of layers which consist of: Bedrock: Clay, Bauxitic clay, Coal & Lignite, Coal – lignite proven, Conglomerate, Dolomite, Igneous and meta-igneous rock, Limestone, a 100m buffer layer on the Ulster White Limestone, Meta-sedimentary rocks, Perlite, Salt, Sandstone and Silica Sand. Superficial (unconsolidated recent sediments) : Sand & gravel and Peat. The data except for the salt and proven lignite resource layers was derived from the 1:50 00 and 1:250 000 scale DigMap NI dataset. This version of the data retains the internal geological boundaries which are dissolved out in the accompanying dissolved version. A user guide 'The Mineral Resources of Northern Ireland digital dataset (version 1)' OR/12/039 describing the creation and use of the data is available.
-
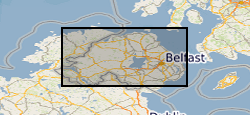
This mineral resource data was produced as part of the Mineral Resource Map of Northern Ireland via a commission from the Northern Ireland Department of the Environment. The work resulted in a series of 21 data layers which were used to generate a series of six digitally generated maps. This work was completed in 2012 with one map for each of the six counties (including county boroughs) of Northern Ireland at a scale of 1:100 000. This data and the accompanying maps are intended to assist strategic decision making in respect of mineral extraction and the protection of important mineral resources against sterilisation. They bring together a wide range of information, much of which is scattered and not always available in a convenient form. The data has been produced by the collation and interpretation of mineral resource data principally held by the Geological Survey of Northern Ireland and was funded via a commission from the Northern Ireland Department of the Environment. These layers display the spatial data of the mineral resources of Northern Ireland. There are a series of layers which consist of: Bedrock: Clay, Coal & Lignite, Coal – lignite proven, Conglomerate, Dolomite, Igneous and meta-igneous rock, Limestone, a 100m buffer layer on the Ulster White Limestone, Meta-sedimentary rocks, Perlite, Salt, sandstone and Silica Sand. Superficial (unconsolidated recent sediments) : Sand & gravel and Peat. The data except for the salt and proven lignite resource layers was derived from the 1:50 00 and 1:250 000 scale DigMap NI dataset. A user guide 'The Mineral Resources of Northern Ireland digital dataset (version 1)' OR/12/039 describing the creation and use of the data is available. A companion set of data with the internal boundaries retained is also available.
 NERC Data Catalogue Service