
Gravity anomalies
Type of resources
Available actions
Topics
Keywords
Contact for the resource
Provided by
Years
Formats
Representation types
Update frequencies
Service types
Scale
-
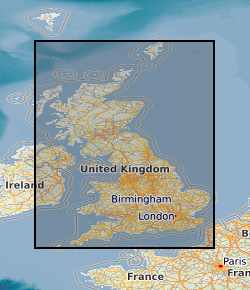
This low-resolution image has been produced from BGS land and marine gravity data. The colour was generated using the BGS COLMAP software package. Colour levels are defined by histogram equalisation. Combining this image with the grey shaded relief image produces a similar image to the colour shaded relief image. The measured gravity values have been corrected in order to show the anomalies attributable to variations in crustal density. In broad terms the blues are attributable to large volumes of low density rocks, the reds to high density rocks. Significant lows occur, for instance, over areas of thick, low density sedimentary rocks(e.g. Cheshire Basin, Wessex Basin), or large granites (eg Cornwall). For marine data, free-air anomalies have been calculated from observed gravity values along marine survey lines. Line intersection errors between crossing lines and overlapping surveys have been used using network adjustment techniques. Free air anomalies have been calculated for sea-bottom stations. For land data, bouguer anomalies have been calculated from gravity observations at points of known height. In order to minimise the effect of topography, Bouguer corrections for the British Mainland have been applied using a density estimated for each station. Elsewhere a correction density of 2.67 Mg/m3 has been used. Corrections for the gravitational effect of terrain have been made where significant, and in a general extent to a radius of 48.6km. The data have been interpolated onto a 1km x 1km grid using a variable tension technique, and smoothed.
-
Data from the British Geological Survey's GeoIndex Geophysics theme are made available for viewing here. GeoIndex is a website that allows users to search for information about BGS data collections covering the UK and other areas world wide. Access is free, the interface is easy to use, and it has been developed to enable users to check coverage of different types of data and find out some background information about the data. More detailed information can be obtained by further enquiry via the web site: www.bgs.ac.uk/geoindex.
-

A collection of 1:250 000 scale geophysical maps in the Universal Transverse Mercator (UTM) projection, covering the United Kingdom and continental shelf areas between 1975 – 1990. Mapping is divided into squares which cover 1 degree by 1 degree of latitude / longitude. A geophysical map is a graphical representation of data collected through various geophysical methods to investigate the subsurface characteristics of the Earth. Geophysics is the study of the physical properties and processes of the Earth using measurements of physical quantities such as gravity, magnetic fields, seismic waves, electrical resistivity, and others. The collection includes aeromagnetic anomaly maps (1975 – 1990), Bouguer gravity anomaly maps (1975 – 1989) and a small number of free air anomaly maps (1981 – 1989). These maps are hard-copy paper records stored in the National Geoscience Data Centre (NGDC) and are delivered as digital scans through the BGS website.
-

A collection of small-scale non-series maps which offer whole-country coverage of the United Kingdom 1856-2013. Included in the collection are geological, tectonic, structural, mineral resource and geophysical maps, together with a small number of historical facsimile maps. Key geological maps included in the collection which ran to many editions are Geology of the British Islands 1:584 000 and the Geological Map of Great Britain 1:625 000. These maps are hard-copy paper records stored in the National Geoscience Data Centre (NGDC) and are delivered as digital scans through the BGS website.