 NERC Data Catalogue Service
xlsx
Type of resources
Topics
Keywords
Contact for the resource
Provided by
Years
Formats
Update frequencies
-
This is supporting data for the manuscript entitled 'DFENS: Diffusion chronometry using Finite Elements and Nested Sampling' by E. J. F. Mutch, J. Maclennan, O. Shorttle, J. F. Rudge and D. Neave. Preprint here: https://doi.org/10.1002/essoar.10503709.1 Data Set S1. ds01.csv Electron probe microanalysis (EPMA) profile data of olivine crystals used in this study. Standard deviations are averaged values of standard deviations from counting statistics and repeat measurements of secondary standards. Data Set S2. ds02.csv Plagioclase compositional profiles used in this study, including SIMS, EPMA and step scan data. Standard deviations for EPMA analyses are averaged values of standard deviations from counting statistics and repeat measurements of secondary standards. Standard deviations for SIMS and step scan analyses are based on analytical precision of secondary standards. Data Set S3. ds03.csv Angles between the EPMA profile and the main olivine crystallographic axes measured by electron backscatter diffraction (EBSD). 'angle100X' is the angle between the [100] crystallographic axis and the x direction of the EBSD map, 'angle100Y' is the angle between [100] crystallographic axis and the y direction of the EBSD map, and 'angle100Z' is the angle between the [100] crystallographic axis and the z direction in the EBSD map etc. 'angle100P' is the angle between the EPMA profile and the [100] crystallographic axis, 'angle010P' is the angle between the EPMA profile and the [010] crystallographic axis, and 'angle100P' is the angle between the EPMA profile and the [001] crystallographic axis. All angles are in degrees. Data Set S4. ds04.csv Median timescales and 1 sigma errors from the olivine crystals of this study. The +1 sigma (days) is the quantile value calculated at 0.841 (i.e. 0.5 + (0.6826 / 2)). The -1 sigma (days) is therefore the quantile calculated at approximately 0.158 (which is 1 - 0.841). The 2 sigma is basically the same but it is 0.5 + (0.95/2). The value quoted as the +1 sigma (error) is the difference between the upper 1 sigma quantile and the median. Likewise the -1 sigma (error) is the difference between the median and the lower 1 sigma quantile. Data Set S5. ds05.xlsx Median timescales and 1 sigma errors from the plagioclase crystals of this study. Results from each of the parameterisations of the Mg-in-plagioclase diffusion data are included: Faak et al, (2013), Van Orman et al., (2014) and a combined expression. Data Set S6. ds06.xlsx Spreadsheet containing the regression parameters and covariance matrices used in this study and in Mutch et al. (2019). Additional versions of the olivine regressions where the ln fO2 is expressed in Pa have been made for completeness. We recommend using the versions where ln fO2 is expressed in its native form (bars).
-
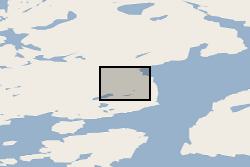
Scanned and annotated thin sections, in plane-polarised and cross-polarised light. Derivative statistical data for mineral grainsize and spatial distribution. Younger Giant Dyke, Tugtutoq, South Greenland.
-
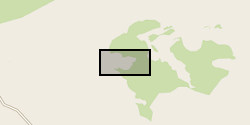
Scanned and annotated thin sections, in plane-polarised and cross-polarised light. Derivative statistical data for mineral grainsize and spatial distribution.