
Bed rock
Type of resources
Available actions
Topics
Keywords
Contact for the resource
Provided by
Years
Formats
Representation types
Update frequencies
Service types
Scale
-

3D geology models have been created for London, Glasgow, Cardiff, Liverpool and Gateshead. Users can create geological cross-sections, synthetic boreholes and horizontal slices through the 3D models. Underpinned by BGS geological data and expertise, the models and reports provide an enhanced understanding of the geological structures and sediments for urban practitioners to inform construction projects, infrastructure design, groundwater assessments and land use planning. These models cover depths from +300 m OD (Ordnance Datum) to -600 m OD. The models which cover Liverpool and London include superficial and bedrock units. The models which cover Glasgow and Cardiff include superficial units on an undifferentiated bedrock base model. The Gateshead Model includes undifferentiated superficial deposits on a bedrock model, but the Superficial Deposits top layer shows the hydro domains map produced for Project Groundwater Northumbria. The models were constructed in the National Geological Model, Urban Geoscience programmes and Project Groundwater Northumbria between 2008-2025 in GSI3D, Groundhog and ASPEN SKUA for deployment to the web viewer. These datasets are managed by the 3D GeoModel project (National Geoscience).
-
The Bedrock summary lithologies dataset is digital geological map across the bulk of the UK Continental Shelf (UKCS), for areas up to a water depth of 200 m, which groups the bedrock lithologies (rock types) into classes based on similar engineering geology characteristics. The map is derived from the 1:250 000 scale digital bedrock map of the UKCS (BGS Offshore Bedrock 250k), which is available separately from BGS. The map was produced in 2014 in collaboration with, and co-funded by, The Crown Estate as part of a wider commissioned project to assess seabed geological constraints on engineering infrastructure across the UKCS. The divisions on the map combine the bedrock formations into 8 classes (with several subdivisions) of similar strength and lithological variability, each with a 'Category' title that summarises their main lithological character: Class1 – Igneous; Class 2 - Tertiary Sandstone and Limestone; Class 2.5 - Tertiary Sandstone and Limestone Interbedded; Class 3 - Tertiary Mudstone; Class 4 - Mesozoic Sandstone and Limestone; Class 4.5 - Mesozoic Sandstone and Limestone Interbedded; Class 5 - Mesozoic Mudstone; Class 6 – Chalk; Class 7 – Metamorphic; Class 8 - Palaeozoic Sedimentary. The data are held by the BGS as an ESRI Shapefile.
-
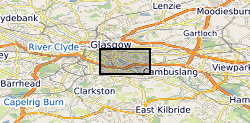
The UK Geoenergy Observatories (UKGEOS) Glasgow 3D coal mine model outputs, created by the British Geological Survey, provide a semi-regional overview of the depth and extent of surveyed and probable coal mine workings, plus stone and coal roads surveyed within the mines. The model allows users to visualise the surveyed and probable coal mine workings to be found beneath this part of Glasgow, applicable at a scale of around 1: 25,000 to 1: 10,000. The data is supplied as grids, triangulated surfaces over a 5 by 4.15 km area, with the depth range to around 300 m below Ordnance Datum. The mine extents are ‘cut out’ of the UKGEOS Glasgow pre-drill bedrock model. This model describes both surveyed (recorded on mine abandonment plan) and probable coal mine workings before the UKGEOS Glasgow boreholes have been drilled, and was used to inform the expected sequence on drilling. Further details and model limitations can be found in the accompanying metadata report http://nora.nerc.ac.uk/id/eprint/522737
-
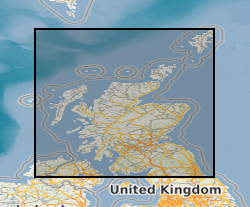
The Bedrock Aquifer Productivity Scotland dataset forms part of the BGS Hydrogeological Maps of Scotland data product. This product is comprised of three datasets: Bedrock Aquifer Productivity Scotland; Superficial Aquifer Productivity Scotland; and Groundwater Vulnerability Scotland. Aquifer productivity is a measure of the potential of aquifers to sustain a borehole water supply. The Bedrock Aquifer Productivity Scotland dataset version 2 (2015) indicates the location and productivity of bedrock aquifers across Scotland, and their groundwater flow characteristics. Developed as a tool to support groundwater resource management, the dataset provides a guide to aquifer characteristics at a regional scale, and may be useful to anyone interested in learning more about, assessing or managing groundwater resources across Scotland. The dataset is delivered at 1: 100 000 scale; the resolution of the dataset being 50 m and the smallest detectable feature 100 m.
-

The Seabed Geology 10k: Bristol Channel is a digital geological map portraying the distribution of the different geological substrate units (either of bedrock or unlithified deposits) present on the seabed at a 1:10 000 scale. Additionally, to the Seabed Substrate layer, this dataset also includes i) a Geomorphology layer, revealing the presence and distribution of seabed morphological and geomorphological features and ii) a Structural Geology layer, that delineates the principal structural features observed at rockhead. The bedrock geology is divided into seven stratigraphical units: Pembroke Limestone Group (PEMB); Mercia Mudstone Group (MMG); Penarth Group (PNG); the Lias Groups' St Mary’s Well Bay (STM), Lavernock Shales (LVN) and the Porthkerry (PO) members; and the Inferior Oolite Group (INO). The Lexicon code of the stratigraphical units is provided in parentheses, as defined in the ‘BGS Lexicon of Named Rock Units’. The superficial deposits mapped are comprised of only marine sediments that were classified based on their grain size. However, Folk classification was not used to define the sediment classes. The sediments are divided into Gravel (V); Sand and Gravel (XSG); Sand (S); Sand and Mud (XSM); Mud (M); and Gravel, Sand and Mud (XVSM). The RCS code of the stratigraphical units is provided in parentheses, as defined in the ‘BGS Rock Classification Scheme’.
-

BGS LithoFrame models provide 3D geological characterisation for parts of the onshore and offshore UK at a range of scales. They present framework geological interpretation consistent with the stratigraphic framing schemes and scales used in BGS geological maps. Models have been constructed under a range of project activities and include local-scale superficial and bedrock models covering sites and focused study areas, medium-scale superficial and bedrock models covering many urban areas, transport corridors and smaller catchments, and regional-scale bedrock models covering large catchments, district areas, and geological basins. The 3D geological models have been constructed in a period between 2003 and 2018 and is managed by the 3D GeoModel project (National and International Geoscience).
-

Concentrations of various elements along with temperature, pH and dissolved oxygen, in hot spring fluids around the world. Bedrock chemistry data for Mars, in situ samples and meteorites, also included. Data from Iceland were partly generated in this study, other data are taken from the literature for comparison. Also included are literature data about associated bedrocks. Sheet 1: concentrations of dissolved elements in hot spring fluids Sheet 2: concentrations of elements in bedrock associated with hot springs Sheet 3: averages of bedrock data Sheet 4: full reference list
-

This Web service provides layers containing data from the BGS Geology 625k (DiGMapGB-625) dataset. BGS Geology 625k provides small-scale (1:625 000 scale) bedrock and superficial geology mapping for use at a regional and national level. The bedrock and superficial data are symbolised by lithology and lithostratigraphy, and a bedrock age layer is also provided for the bedrock layer. Additional linear features (faults) and dykes layers are provided for use in conjunction with the bedrock layer. For more information about the digital maps available from the British Geological Survey, please visit https://www.bgs.ac.uk/geological-data/. The data are provided through this service for view and download under the Open Government Licence.
-

The UK Geoenergy Observatories (UKGEOS) Glasgow 3D coal mine model outputs, created by the British Geological Survey, provide a semi-regional overview of the depth and extent of surveyed and probable coal mine workings, plus stone and coal roads surveyed within the mines. The model allows users to visualise the surveyed and probable coal mine workings to be found beneath this part of Glasgow, applicable at a scale of around 1: 25,000 to 1: 10,000. The data is supplied as grids, triangulated surfaces over a 5 by 4.15 km area, with the depth range to around 300 m below Ordnance Datum. The mine extents are ‘cut out’ of the UKGEOS Glasgow post-drill bedrock model. This model describes both surveyed (recorded on mine abandonment plan) and probable coal mine workings. An area of probable workings has been updated to account for the results of drilling borehole GGC01. Further details and model limitations can be found in the accompanying metadata report http://nora.nerc.ac.uk/id/eprint/531157/
-

Data identifying landscape areas (shown as polygons) attributed with geological names and rock type descriptions. The data is presented at 1:50 000 scale. Onshore coverage is provided for England, Scotland, Wales and the Isle of Man. Approximately 99% coverage is available and BGS is committed to completing the coverage, and ongoing updates as part of its ongoing national survey. Bedrock geology describes the main mass of solid rocks forming the earth's crust. Bedrock is present everywhere, whether exposed at surface in outcrops or concealed beneath superficial deposits or water bodies. The bedrock geology of Great Britain is very diverse and includes three broad classes based on their mode of origin: igneous, metamorphic, and sedimentary. The data includes attribution to identify each rock type (in varying levels of detail) as described in the BGS Rock Classification Scheme (volumes 1-3). The bedrock has formed over long periods of geological time, from the Archean eon some 4000 million years ago, to the relatively young Pliocene, 5.33 million years ago. The age of the rocks is identified in the data through their BGS lexicon name (published for each deposit at the time of the original survey or subsequent digital data creation). For stratified rocks i.e., arranged in sequence, this will usually be of a lithostratigraphic type. Other rock types for example intrusive igneous bodies will be of a lithodemic type. More information on the formal naming of UK rocks is available in the BGS Lexicon of Named Rock Units. Geological names are based on the lithostratigraphic or lithodemic hierarchy. The lithostratigraphic scheme arranges rock bodies into units based on rock-type and geological time of formation. Where rock-types do not fit into the lithostratigraphic scheme, for example intrusive, deformed rocks subjected to heat and pressure resulting in new or changed rock types; then their classification is based on their rock-type or lithological composition. This assesses visible features such as texture, structure, mineralogy. The data are available in vector format (containing the geometry of each feature linked to a database record describing their attributes) as ESRI shapefiles and are available under BGS data licence.