 NERC Data Catalogue Service
2016
Type of resources
Available actions
Topics
Keywords
Contact for the resource
Provided by
Years
Formats
Representation types
Update frequencies
Scale
Resolution
-

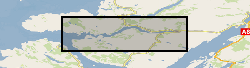
1. Grids (in spreadsheet form) of interpreted parameters from the 3D time-lapse seismics (temporal and constructed depth thicknesses) at the Sleipner CO2 storage operation in the North Sea. 2. A synthetic seismic model of a CO2 wedge, to examine the relationship between wedge true thickness and temporal thicknesses. These datasets underpin following publications: Chadwick, R.A., Williams, G.A. & White, J.C. 2016. High resolution imaging and characterisation of a CO2 layer at the Sleipner CO2 Storage operation using time-lapse seismics. First Break, 34, 79-87. The source data comprise the Sleipner 3D time-lapse surveys which were acquired in 1994 (baseline), 1999, 2001, 2002, 2004, 2006, 2008 and 2010. The dataset used here for measuring temporal thicknesses is the 2010 high resolution dataset with constructed depth thicknesses from the 1994 baseline data. Grant number: EP/K035878/1.
-

These data accompany a manuscript, titled: Stream and Slope Weathering Effects on Organic-rich Mudstone Geochemistry and Implications for Hydrocarbon Source Rock Assessment: A Bowland Shale Case Study All files with prefix 'Man_1' relate to this submission. The manuscript was submitted to the journal Chemical Geology in December 2016. Data include: 1) A range of photographs from the outcrop, drill cores, sub-samples, 'weathering grades' and thin section microphotographs from the Bowland Shale; 2) The results of mineralogical (whole rock powder x-ray diffraction; XRD) analyses for 18 subsamples; 3) The results of inorganic geochemical analyses (LECO elemental C and S, x-ray fluorescence major and trace elements) for 18 subsamples; 4) The results of organic geochemical analyses (Rock-Eval pyrolysis, d13Corg) for 20 subsamples; 5) RStudio scripts used to conduct statistical analyses (e.g., Principal Components Analysis) and generation of figures.
-
Geochemical data: %C, %OC, %IC, %N Physical Property data: Wet and dry bulk density, water content, porosity. Sediment cores extracted from Offshore Region: Loch Sunart NM 70277 63360, 56.705259, -5.7545471. For more information see published report, Substantial stores of sedimentary carbon held in mid-latitude fjords. / Smeaton, Craig; Austin, William; Davies, Althea; Baltzar, A.; Abell, R. E.; Howe, J. A. doi:10.5194/bg-13-5771-2016
-

Inductively Coupled Plasma Mass Spectrometry data, part of a suite of 51 elements using aqua regia ICP-MS techniques at ALS Minerals (Ireland).
-

Rotating Rayleigh-Benard convection. Table of the input and output parameters of the simulations. Snapshot of the temperature field, three components of the velocity and three components of the magnetic field in 3D. Data generated with a magnetohydrodynamical code of rotating Boussinesq convection in planar geometry (Cattaneo et al. 2003 ApJ 588 1183-1198). Data published in Guervilly, Hughes & Jones 2014 JFM 758 407-435 (DOI:10.1017/jfm.2014.542) and Guervilly, Hughes & Jones 2015 PRE 91 041001 (DOI: 10.1103/PhysRevE.91.041001)
-
Data for NERC grant NE/L000660/1. This is the data supporting Fig. 4 of the publication: Ebigbo, A., Lang, P. S., Paluszny, A., and Zimmerman, R. W. (2016). Inclusion-based effective medium models for the permeability of a 3D fractured rock mass. Transport In Porous Media, DOI: 10.1007/s11242-016-0685-z. It contains numerically computed permeabilities for various realisations of fracture networks. There are six different cases (as explained in the paper).
-
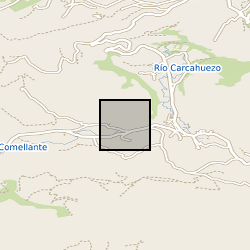
The data set provides climate and cave monitoring data from Cueva de Asiul, Cantabria, northern Spain. This data was initially presented in graphical form in Smith et al., (2015) - Drip water Electrical Conductivity as an indicator of cave ventilation at the event scale. Science of the Total Environment, 532, 517-527. All data was collected from within the cave or within a 1km radius of the cave site (43°19'0"N, 3°35'28"W) using instrumentation set up as part of a PhD project running between January 2010 and January 2014. The data set includes high resolution event based monitoring data for a range of climatic parameters - cave and external temperature, rainfall amount, soil pCO2 cave air pCO2 concentration, cave drip water calcium saturation, drip water electrical conductivity and cave air pressure. This data was analysed at Lancaster University, UK or at the NERC isotope geosciences laboratory, British Geological Survey, UK. Any missing data from this 4 year period is a result of instrument malfunction and is clearly explained within the above cited paper. The electrical conductivity component of the data set offers the first data set of this type form any cave system, using a submerged CTD Diver probe and novel piston flow housing. The rest of the data constitute a part of a larger cave monitoring data set produced during the project using a number of standard automated cave monitoring devices. When combined this data leads us to conclude that cave drip water electrical conductivity is driven primarily by changes in cave air pCO2 at Cueva de Asiul and therefore responds to cave ventilation dynamics, rather than by changes in karst water residence time. Without such extremely high resolution monitoring the impact of cave ventilation on event based changes in drip water electrical conductivity would not have been established for this site. This data set should be of interest to anyone studying similar cave sites, interested in the role of electrical conductivity as a monitoring tool within caves and cave ventilation on speleothem growth dynamics. The data set was collected by members of Lancaster University and the Matienzo caving expedition as part of NERC studentship grant NE/I527953/1. All cave monitoring was undertaken with kind permission from Gobierno de Cantabria, Cultura.
-

Linear features (shown as polylines) in BGS Geology 50k are used to portray geological features and concepts that are normally depicted on maps in linear form, rather than polygonal form. The data is presented at 1:50 000 scale. Onshore coverage is provided for England, Scotland, Wales and the Isle of Man. Approximately 99% coverage is available and BGS is committed to completing the coverage, and ongoing updates as part of its ongoing national survey. Linear features are associated most closely with the bedrock theme either as an intrinsic part of it for example marine bands or affecting it in the case of faults. However, landform elements are associated with both bedrock and superficial deposits. The linear features are organised into seven main categories: Alteration areas: areas indicating zones of change to the pre-existing rocks due to the application of heat and pressure that can occur round structural features such as faults and dykes. The linear feature defines the estimated boundary of the change. Fault: where a body of bedrock has been fractured and displaced by a large-scale process affecting the earth’s crust. The linear feature is used to represent a 3-dimensional plane of disruption on a 2-dimensional map. The line itself typically defines a broader zone of displacement/failure, rather than an individual fault plane. Fold Axis: where strata are bent or deformed resulting from changes or movement of the earth’s surface creating heat and pressure to reshape and transform the original horizontal strata. Folds appear on all scales, in all rock types and from a variety of causes. The linear feature is used to represent the “hinge” of the folds (which is a 3-dimensional plane being represented on a 2-dimensional map). Fossil horizon: where prolific fossil assemblages occur and can be used to help establish the order in which deposits were laid down (stratigraphy). These horizons allow correlation where sediments of the same age look completely different due to variations in depositional environment. The linear feature is used to represent a layer of material that is typically too thin to be shown as a polygon on the map. Landforms: define the landscape by its surface form; these include glacial features such as drumlins, eskers, and ice margins. The linear feature is typically used to represent a boundary, or centre line that defines the form of the feature. Mineral vein: where concentrations of crystallised mineral occur within a rock, they are closely associated with faulting but may occur independently. The linear feature defines the estimated extent of the mineralised vein, but does not indicate the volume of wall rock that has been affected. Rock: lines representing beds of notable geological materials and key marker beds, e.g., coal, gypsum, ironstone relevant to the Bedrock theme. The linear feature is used to represent a layer of material that is typically too thin to be shown as a polygon on the map. The data are available in vector format (containing the geometry of each feature linked to a database record describing their attributes) as ESRI shapefiles and are available under BGS data licence.
-
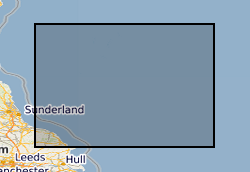
Reports, images, GIS and gridded products describing the Palaeozoic geology and conventional petroleum in and around the Mid North Sea High (Quadrants 25-44). Covering a large area of the Central North Sea from the Forth Approaches to the northern side of the Southern North Sea, the focus is on Devonian and Carboniferous rocks. The peer-reviewed products were produced for the 21CXRM Palaeozoic Project by BGS for DECC/OGA, Oil and Gas UK and oil company sponsors between November 2014 and May 2016, to improve regional digital datasets and knowledge of the underexplored Palaeozoic petroleum systems, and to stimulate exploration. The petroleum systems analysis was based on new interpretations of extensive well, seismic, gravity-magnetic and source rock datasets, integrated with petrophysical studies, basin modelling and UK onshore knowledge. Released data were collated and interpreted, and interpretations of unreleased data were included with agreement of the data owners. Unreleased raw data is excluded, as is the UK Government Seismic data released in 2016. The datasets are applicable for use at scales between 1:750,000 to 1: 3,000,000.
-
This dataset is the Derived Postcode Database issued as part of the GeoSure Insurance V7 incorporating postcode data from OS Code-Point Open version 2016.1. The GeoSure Insurance Product (including the Derived Postcode Database) represents the end of an interpretation process, starting with the BGS Digital Geological Map of Great Britain at the 1:50,000 scale (DiGMapGB-50). This digital map is the definitive record of the types of rocks underlying Great Britain (excluding the Isle of Man), as represented by various layers, starting with Bedrock and moving up to overlying Superficial layers. In 2003, the BGS also published a series of GIS digital maps identifying areas of potential natural ground movement hazard in Great Britain, called GeoSure. There are six separate hazards considered - shrink-swell clays, slope instability, dissolution of soluble ground, running sand, compressible and collapsible deposits. These maps were derived by combining the rock-type information from DiGMapGB-50 with a series of other influencing factors which may cause the geological hazards (e.g. steep slopes, groundwater). In 2005, the BGS used the GeoSure maps to make an interpretation of subsidence insurance risk for Great Britain property insurance industry, released as the new GeoSure Insurance Product. This represents the combined effects of the 6 GeoSure hazards on (low-rise) buildings in a postcode database - the Derived Postcode Database, which can be accompanied by GIS maps showing the most significant hazard areas. The combined hazard is represented numerically in the Derived Postcode Database as the Total Hazard Score, with a breakdown into the component hazards. The GeoSure Derived Postcode Database (DPD) is a stand-alone database, which can be provided separately to the full GeoSure Insurance Product V7. The methodology behind the DPD involves balancing the 6 GeoSure natural ground stability hazards against each other. The GeoSure maps themselves have a fivefold coding (A to E), and the balancing exercise involves comparing each level across the six hazards e.g. comparing a level C shrink-swell clay area with a level C running sand area. The comparison is done by a process involving expert analysis and statistical interpretations to estimate the potential damage to a property (specifically low-rise buildings only). Each level of each of the hazards is given a 'hazard score' which can then be added together to derive a Total Hazard Score at a particular location (e.g. within a given postcode).