 NERC Data Catalogue Service
unknown
Type of resources
Available actions
Topics
Keywords
Contact for the resource
Provided by
Years
Formats
Representation types
Update frequencies
Resolution
-

This data set consists of thermal property testing results including thermal conductivity, thermal diffusivity, porosity, permeability and density. The data is presented in an excel spreadsheet with two tabs, one containing the data itself and one containing a description of each column. The testing was carried out on behalf of the BGS Geothermal and energy storage programs between 2020 and 2025. The samples were predominantly plugs (24x38mm) or wedges (usually quarter core of various lengths) taken from borehole core. The following boreholes were sampled as part of the project. • UKGEOS CHESHIRE A-101 • Frodsham Marsh • Stanlow • Killingholme DG1 • Speke Reservoir • Carnaby • UKGEOS GGC01 • KEYWORTH D (GSHP 3) • SUTTON BONINGTON SB4 These sites were chosen to support characterisation activities around BGS projects such as the UK GeoEnergy Observatories project and the drilling of a ground source heat well on site at BGS Keyworth.
-

The Geo-Assessment Matrix (the Matrix) is a pan-European dataset highlighting the key geological features and associated engineering constraints for Offshore Wind Farm (OWF) development. Such geological features include: lithology; biogenic processes; mass flow processes; fluid flow; morphology and geomorphology associated with glacial, coastal, fluvial and marine settings. There is currently no universally adopted methodology or classification system to assess ground conditions at OWF sites. This lack of standardisation makes it difficult to compare siting conditions across different regions in Europe. The Geo-Assessment Matrix introduces a unified methodology designed to address these challenges. Results provide data attributions that can be used to create pan-European geological maps to better understand the geological constraints of the subsurface for offshore development. The Matrix is useful for stakeholders such as research institutes (Geological Surveys), marine spatial planners, government agencies and OWF developers. A matrix style is adopted providing a structured comparison of geological and engineering constraints for the development of different OWF foundation types (piles, suction caisson, gravity based structures – GBS, and cables). A final qualitative unmitigated geological constraint score is provided for evaluating the suitability of different seabed conditions: ‘Higher’, ‘Moderate’ and ‘Lower’ constraints. As this is a qualitative assessment, they are comparative terms, permitting categories that reflect the relative difference. - Higher constraint: Geological features may present significant challenges to engineering solutions. These are typically (but not limited to) geohazards, such as organic soils, pockmarks, active sedimentary systems, slope instability and soft sediments. - Moderate constraint: Geological features may be suitable for foundations, however, likely need additional engineering design/solutions mitigation measures. These are typically variable sedimentary features, such as heterogeneous sediments, mobile sediments, weak bedrock and gravel. - Lower constraint: Geological features are likely suitable for foundations. These are typically more predictable sediments, such as homogeneous or layered sediments or strong bedrock. Note that some features may still require mitigation measures. Outputs from the Matrix help to inform early decision-making and spatial planning by highlighting areas of relative geological constraint in countries during the early stages of offshore wind development.
-

The BGS PSA dataset provides insurers and homeowners access to a better understanding of the shrink-swell hazard at both the individual property and/or postcode level for Great Britain. It builds upon the GeoSure shrink-swell data by mapping the hazard to the individual building polygon and considering the other susceptibility factors of building type, foundation depth, and drainage and tree proximity. The user receives GIS building polygons with an overall susceptibility to subsidence score between 1-100. Scores are also classified from non-plastic to very high. Each building polygon is also scored from 1-10 for each subsidence factor (geology, foundation, drainage, building type, building storey and tree proximity). Postcode data is also available as a table and shapefiles showing the ‘average’ PSA score for all buildings within the postcode. The identification of shrink-swell related subsidence prone areas, alongside the inclusion of potential sources to exacerbate this phenomena, can better inform insurers and homeowners and form the basis to make decisions concerning prevention and remediation. The product enhances geological information obtained from GIP and GeoSure via the inclusion of the crucial shrink-swell susceptibility factors (proximity to trees and foundation depth). This therefore allows the derivation of a risk element for the housing stock at Building level, which is then generalised to Postcode level.
-
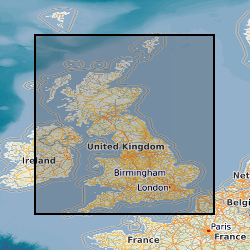
The BGS Permeability Index dataset shows estimated rates of water movement from the ground surface to the water table. The v8 dataset incorporates the latest geology mapping (BGS Geology 50k). This includes updates to the lithology-coding schema, the LEX_RCS. A 2-part code used to identify the named rock unit from the BGS lexicon of named rock units (LEX) followed by a Rock Classification Scheme (RCS) code which describes the rocks lithological characteristics e.g. texture and composition. Updates to these codes and latest dissolution hazard data sourced from BGS GeoSure: Soluble Rocks have been reviewed and classified as part of the version 8 release. The dataset covers Great Britain and is presented at a scale of 1:50 000, based on the geological data at the same scale. However, in areas where the geology is not mapped to this scale, the next best available scale is used. The BGS Permeability Index can be used to compare the relative permeability of deposits at the regional scale, indicating where highly permeable rocks could allow rapid infiltration to occur, or where less permeable rocks are present and water could pond on the ground surface. The dataset can be used as a component in a wide range of geo-environmental assessments such as natural flood management, Sustainable Drainage Systems, engineering desk studies, slope stability, and aquifer vulnerability. It is for use at the regional scale and is not recommended for use at the site-specific scale.
-

The data is a first digital release of the UK legacy geothermal catalogue of temperature measurements, thermal conductivity measurements and heat flow calculations. The geothermal catalogue comprises data contained in numerous historic technical reports from the 1977-1991 Geothermal Energy Programme, delivered by BGS and funded by the then UK Department of Energy and the European Commission. This release contains 11,821 data points derived from 743 sites. This first digital release contains data that has been: spatially located, an identified data source, intellectual property rights (IPR) checked and assessed for release under version 3 of the Open Government Licence (OGL). There are known limitations on the dataset, including that the data is provided as it was listed in the UK legacy geothermal catalogue. Validation of the IPR and copyright status of some of the incorporated datasets was challenging and a take down policy is in operation. Further details can be found in the accompanying report https://nora.nerc.ac.uk/id/eprint/537202
-
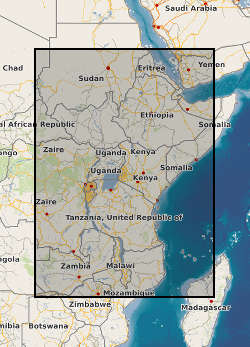
A geographic information system (GIS) heat flow and temperature model of East Africa created by extracting data from open sources into a series of shapefiles and rasters containing information on geothermal sites, hot spring locations, digital elevation model, surface temperature, geothermal gradients, thermal conductivities and heat flow data, major faults, surface geology, crustal basement, electrification grid system and population density across East Africa. This data is stored in the World Geodetic System (WGS) 1984 Geographic Projection System.
-
The QUEST-GSI WPd1 "Climate scenarios". The aim was to construct climate scenarios representing the effects of uncertainty and different rates of climate forcing. This dataset contains model data which construct climate scenarios. The project requires climate scenarios which (a) characterise the uncertainty in the climate change associated with a given forcing, including changes in climate variability and extreme events, and (b) allow the construction of generalised relationships between climate forcing and impact.
-
This dataset contains Fluorescence Assay Gas Expansion measurements of OH, HO2 and RO2 made at the Institute of Atmospheric Physics land station (IAP), Beijing site during the winter and summer APHH-Beijing campaigns for the Atmospheric Pollution & Human Health in a Chinese Megacity (APHH) programme. The measurements were taken using the FAGE (Fluorescence Assay by Gas Expansion) technique which is a LIF (laser induced fluorescence) that measures on-resonance fluorescence at 308 nm. HO2 and RO2 are converted to OH via reaction with NO and NO + CO respectively. The instrument is calibrated by photolysis of known concentration of water vapour at 185 nm to generate know concentrations of OH and HO2, same method used for HO2 but NO is injected into the flow to convert HO2 to OH. RO2 is calibrated by photolysing water vapur at 185 nm to generate OH but CH4 is added to convert OH to CH3O2, then CH3O2 is converted to OH using CO and NO. The calibration was preform every three days on campaign, and from this we can convert counts measured into concentration. The units for OH, HO2 and RO2 and there associated errors is molecules cm-3. The data has been filtered for instabilities in data collection including unstable pressure, unstable online, low laser power and not going online correctly. The data has been flagged for when the values were below limit of detection.
-
Data from the GSFC (Goddard Space Flight Centre) GEOSCCM model simulations, part of the International Global Atmospheric Chemistry (IGAC)/ Stratosphere-troposphere Processes and their Role in Climate (SPARC) Chemistry-Climate Model Initiative phase 1 (CCMI-1). CCMI-1 is a global chemistry climate model intercomparison project, coordinated by the University of Reading on behalf of the World Climate Research Programme (WCRP). The dataset includes data for the CCMI-1 reference experiments ref-C1 and ref-C2. ref-C1: Using state-of-knowledge historic forcings and observed sea surface conditions, the models simulate the recent past (1960–2010). ref-C2: Simulations spanning the period 1960–2100. The experiments follow the WMO (2011) A1 baseline scenario for ozone depleting substances and the RCP 6.0 (Meinshausen et al., 2011) for other greenhouse gases, tropospheric ozone (O3) precursors, and aerosol and aerosol precursor emissions.
-
This data set is part of the ESA Sea Ice Climate Change Initiative (CCI) project. The dataset provides sea ice concentration for the Antarctic region, derived from the AMSR-E satellite instrument. It consists of daily gridded SIC fields based on Passive Microwave Radiometer measurements from the AMSR-E instrument with a 25km grid spacing, along with the total standard error (uncertainty) and quality control flags. It has been built upon the algorithms and processing software originally developed at the EUMETSAT OSI SAF for their SIC dataset. Please note, in the sea ice concentration data set - on purpose - no weather filter has been applied to eliminate weather-induced spurious ice in the open ocean along the ice edge in order to avoid discarding regions with a real sea ice cover. Users are advised to read the product user guide and the publication by Ivanova et al. [2015] (see documentation section). A second sea ice dataset has also been produced from the SSM/I instrument, and these should be regarded as individual datasets and not combined without further investigations about the compatibility. The project team warns potential users that the AMSR-E SIC time-series is less mature than the SSM/I one, and that the former should be used with extra care, possibly after visual inspection or comparison to other data sources (such as the SSM/I time series during the overlap period)