 NERC Data Catalogue Service
Hysteresis
Type of resources
Available actions
Topics
Keywords
Contact for the resource
Provided by
Years
Formats
Representation types
Update frequencies
Resolution
-
HystLab (Hysteresis Loop analysis box), is MATLAB based software for the advanced processing and analysis of magnetic hysteresis data. Hysteresis loops are one of the most ubiquitous rock magnetic measurements and with the growing need for high resolution analyses of ever larger datasets, there is a need to rapidly, consistently, and accurately process and analyze these data. HystLab is an easy to use graphical interface that is compatible with a wide range of software platforms. The software can read a wide range of data formats and rapidly process the data. It includes functionality to re-center loops, correction for drift, and perform a range of slope saturation corrections.
-
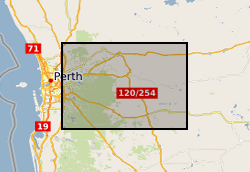
Rock magnetic data corresponding to demagnetisation (LIV_DEMAG) and paleointensity (LIV_PI) data submitted as part of this grant. This data is divided into two subfolders, "Kappabridge" and "VFTB", corresponding to the instrument used to acquire the data. Those folders each contain one or more folders labelled with a four letter code, corresponding to a specific locality and/or experiment type, matching the letter codes in LIV_DEMAG and LIV_PI. The Kappabridge folders then contain raw data files of temperature-dependent magnetic susceptibility, and the VFTB folders contain raw data files of hysteresis, coercivity, isothermal remanent magnetisation and thermomagnetic curve measurements. CFEH corresponds to clinker samples from USA attempting to isolate an Epsilon Hematite phase. LPRM are data from Kinghorn and Wormit Bay volcanics in Scotland, ~330 Ma, specifically for samples given a lab TRM at 80uT and a PRM at 80uT. WTBY are Devonian volcanics from Wormit Bay, sampled in 2015. YDSR are data from Yandiniling Dike Swarm, Yilgarn Craton in Australia, sampled Nov 2018.
-
This data set covers high resolution (30-min frequency) water quality and dissolved carbon data from a peatland river in Southwest Scotland (5.8 km2), part of the Whitelee Wind Farm complex. The data set covers approx. 2.5 years including two full hydrological years and 261 individual flood events between 23/05/2012 and 16/12/2014. Carbon data was measured using a Scan Spectrolyser – a field deployable UV-Vis light spectrometer. Full details about this dataset can be found at https://doi.org/10.5285/4c591c29-01c9-493b-806e-7253e2682376
-
This data resource consists of a nutrient concentration time series for the River Frome at East Stoke, Dorset, gathered between January 2004 and February 2006. Total phosphorus concentration data was gathered for the full duration of the project. Soluble reactive phosphorus, total oxidisable nitrogen and dissolved reactive silicon concentration was only gathered from Jan 2005 until Feb 2006. Sampling interval varied throughout the monitoring period, from a minimum of two samples to day, to eight per day during storm events (with an average of three samples per day throughout the duration of the monitoring period). Samples were taken from the main flow of the river using an automatic water sampler, and analysed using standard colorometric methods, at the CEH Dorset laboratories. Further details of the field and laboratory procedures are outlined in Bowes MJ, Smith JT, Neal C. The value of high resolution nutrient monitoring: a case study of the River Frome, Dorset, UK. Journal of Hydrology 2009; 378: 82-96. Full details about this dataset can be found at https://doi.org/10.5285/7af4c236-5148-4d3d-815c-b6451aee67a5