
Seismology
Type of resources
Available actions
Topics
Keywords
Contact for the resource
Provided by
Years
Formats
Representation types
Update frequencies
Scale
-

Field reports and macroseismic questionnaires for recent British earthquakes. As of 2003, data collection for this dataset is mostly digital.
-

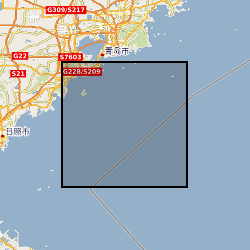
Synthetic and real dispersion measurements for paths across the Pacific, consists of 2 datasets; SS3DPacific_new - This is a data set of surface-wave dispersion measurements. The dispersion is measured between a synthetic reference seismogram (computed with normal-mode summation using the MINEOS software in the radial model stw105 from Kustowski et al., 2008), and a real observed seismogram. This data set is used by Latallerie et al. (2024) to build a Vs model of the Pacific upper-mantle with full 3D resolution and uncertainty using SOLA inversion (Zaroli 2016) and finite-frequency theory (Zhou 2009). Data are for a set of source-receiver pairs for frequencies ranging from 6 to 21 mHz, every 1mHz. The measurement algorithm uses the multi-taper technique (Thompson 1982). The first 5 Slepians are used (Slepian 1978). A datum is the average of measurements over these tapers, and the uncertainty is the standard deviation. SS3DPacificSyn_new - This is a data set of surface-wave dispersion measurements. The dispersion is measured between a synthetic reference seismogram (computed with normal-mode summation using the MINEOS software in the radial model stw105 from Kustowski et al., 2008), and a synthetic seismogram computed using the spectral element method software Specfem in the 3D model S362ANI from Kustowski etl al. (2018). This data set is used by Latallerie et al. (2024) in a synthetic tomography study to retrieve the Vs structure of the input 3D model S362ANI in the Pacific upper-mantle with full 3D resolution and uncertainty using SOLA inversion (Zaroli 2016) and finite-frequency theory (Zhou 2009). Measurements are provided for source-receiver pairs for frequencies ranging from 6 to 21 mHz, every 1mHz. The measurement algorithm uses the multi-taper technique (Thompson 1982). The first 5 Slepians (Slepian 1978) are used. A datum is the average of measurements over these tapers, and the uncertainty is the standard deviation.
-

This is a collection of extracts from British newspapers describing earthquakes, mostly British. It contains original clippings, photocopies, and in a few cases manual transcriptions.
-
This catalogue contains the times, locations, families, and durations of earthquakes identified near Parkfield, California, USA. Collected over the period of 2020 – 2022. The methodology used to identify the earthquakes is described by Huang, H., Hawthorne, J.C. Linking the scaling of tremor and slow slip near Parkfield, CA. Nat Commun 13, 5826 (2022). https://doi.org/10.1038/s41467-022-33158-3. The data provided here are also provided in the supplement of that paper. This catalogue contains the times (columns 1-2), locations (columns 3-5: latitude, longitude, and depth), families (column 6), and durations (columns 7).
-

This dataset contains broadband seismic data collected between May 2018 and January 2019 as part of the Unsettled Earth project funded by the University of Bristol's Brigstow Institute. The seismic station was deployed in one of the turrets of the Wills Memorial Building Tower, Bristol.
-
The National Seismological Archive (NSA) is the United Kingdom national repository for seismological material. It was created principally to preserve data from seismological observatories in the UK that have now closed. In many cases in the past records have been lost or destroyed when there is no longer anyone to look after them; the NSA provides a permanent home for these historical scientific documents, to preserve them for posterity. The principal collection consists of the seismograms stores from defunct observatories; also bulletins and reports from all over the world dating from the 1890s onwards, held in a variety of media, including earthquake-related newspaper cuttings, glass slides, microfilm, and comprehensive UK earthquake research material collected over a 30 year period. One of the major projects of the archive has been the presentation of current knowledge of UK historical earthquake seismology material in a short series of reports, easily accessible to researchers. Data includes: Bulletins and correspondence from historical UK observatories; The Ambraseys collection of papers and notes concerning world seismicity; Reports and bulletins from the BGS seismology group; Collected documents concerning seismographs and UK earthquakes; Paper felt report forms distributed and collected by the BGS for earthquakes from the early 1980s until web based forms replaced them.
-

Earthquake catalogue of all known UK events until 1969. The catalogue covers the offshore areas as well as mainland UK, covering an area between 10 degrees West to 4 degrees East and 49 degrees to 62 degrees North. This includes all of Ireland and some earthquakes in northern France that were also felt in the UK. Earthquakes outside this area are also included if they were felt in the UK. The historical catalogue has been compiled, in general, from macroseismic observations (ie felt effects). Before 1700, only earthquakes with magnitudes of 4.0 ML or greater are included. After 1700, all known events with magnitudes of 3.0 ML or greater are included together with some other, smaller ones. Accuracies of magnitude, location, and origin time vary with the quality of information available.
-

This repository contains data and inversion results for the SOLA finite-frequency tomography of the Pacific upper-mantle. It is linked to the paper by Latallerie et al., in prep, which follows one from the synthetic tomography paper (Latallerie et al., 2025, Seismica), which both provide more information. The code repository for the finite-frequency SOLA tomography can be found at Gitlab: https://gitlab.com/FranckLatallerie/sola_ffsw.git The dataset consists of Rayleigh wave phase delays (dispersion) measured on vertical component seismograms for earthquake-receiver pairs across the Pacific hemisphere. Phase delays are measured using synthetic reference seismogram computed with normal-mode summation using the MINEOS software (e.g. Masters et al., 2011) in the radial reference model stw105 (Kustowski et al., 2008). Observed seismograms were downloaded from the Earthscope (formerly IRIS) Data Management Center (IRIS DMC, 2012). All network and stations used are listed in the Acknowledgements of the README file. The model represents the vertically polarised shear wave velocity (Vsv) 3D structure of the upper mantle in the Pacific. It is accompanied by full 3D resolution and uncertainty. The 3D tomographic grid is made of voxels of size 2 by 2 degrees laterally, and 25 km vertically, spanning the whole sphere, starting at the surface down to ~400km depth. In the files, the longitude is the fastest varying coordinate, then latitude, followed by radius. The midpoints of the voxels range between 1 and 359 for longitude and between 89 (north) to -89 (south) for latitude, both in steps of 2 degrees, while radius changes from 6358.5 to 5983.5 km inclusive, in steps of 25 km.
-

PROJECT DETAILS ONLY - NO DATA. Since 20 September, 2005, an ~120 km-long segment of the Red Sea rift system in Ethiopia has been rocked by 31 earthquakes detected on seismometers worldwide. Ashes emanating from long, open fissures at the surface have blanketed a much wider area, displacing ~50,000 people and their livestock. Colleagues from Addis Ababa University report new fault scarps, and new displacements along existing fault scarps; these faults provide direct measures of rates of crustal deformation that can only be inferred from routine monitoring. The active rupture zone is much larger than has been associated with other historic sequences in the Afar depression, and other continental rift zones worldwide, suggesting this linked tectonic-volcanic crisis is a major event. Thus, the Boina seismo-volcanic crisis provides a superb opportunity to record directly the processes of continental breakup leading to the formation of a new ocean basin. Routine seismic, volcanic, and geodetic monitoring provides information on the time-averaged deformation, but misses the sometimes catastrophic discrete events that achieve the tectonic processes. This proposal aims to: 1) establish a seismic monitoring network to measure aftershock sequences and lava movement within the plate; 2) investigate reports of new eruptions and measure gas emissions from vents along the length of the rupturing segment and compare them with earlier baseline measurements from Afar; and 3) use space-based radar images acquired prior to, during, and after the crisis to measure the magnitude and extent of deformation across the region. Simple elastic modelling of seismic and radar interferometry results will allow us to estimate the proportion of tectonic vs magmatic deformation associated with continental rupture. Additionally, our measurements will provide a firm basis for hazard mitigation for the Ethiopian government coping with this catastrophe, supplementing the sparse infrastructure established by our Ethiopian colleagues.
-

PROJECT DETAILS ONLY - NO DATA. Numerical models (sleep, 1996,1997) of mantle plumes that consider variations in lithospheric thicknesss suggest that deep cratonic roots influence the flow of hot, bouyant plume material. This process may explain the longlevity of cold, thick cratonic roots and the generation of kimberlites in crtons. We will use these methods to: a) predict the temporal and spatial distribution of adiabatic decompression melting and b) track the diamond/graphite stability field beneath and along the margins of the supeior craton, the world's largest, and the small tanzania craton, working in collaboration with n. Sleep. Initial lithospheric rhickness will be constrained by new and existing seismic, as well as zenolith, gravity, and heat flow data. These results will improve models for mineral exploration, as well as plume processes.