 NERC Data Catalogue Service
Mineral exploration
Type of resources
Available actions
Topics
Keywords
Contact for the resource
Provided by
Years
Formats
Representation types
Update frequencies
Scale
-
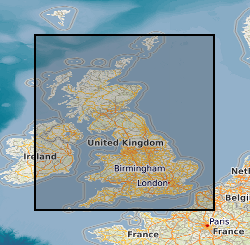
The database contains an index to over 600 ground geophysical surveys carried out in the UK for a variety of projects. A large number of these surveys were done for the DTI Mineral Reconnaissance Programme in the 1970s and 80s; many others were done at the request of BGS field mapping groups. Information held describes the survey objective, location of measurements, geophysical methods and equipment used, reports and publications, storage locations of data and results (for analogue and digital data), dates and personnel.
-
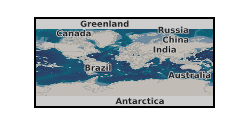
The raster provide the output of a machine-learning random forest algorithm modelling the occurrence of ferromanganese (Fe-Mn) crust deposits in the world ocean. This raster constitutes a data-driven approach for mineral prospectivity mapping of Fe-Mn crusts that should be used in conjunction with other expert-driven prospectivity analysis to guide the assessment of Fe-Mn crust coverage in the world ocean and potential mineral exploration. The raster contains values between 0.07 and 0.92. Any values outside of that range (e.g., 0) are outside of the model prediction and should not be displayed. To reproduce data as displayed in the forthcoming associated publication, it is recommended to apply a 'Percent Clip' stretched 'Viridis' colour scheme.
-

PROJECT DETAILS ONLY - NO DATA. Numerical models (sleep, 1996,1997) of mantle plumes that consider variations in lithospheric thicknesss suggest that deep cratonic roots influence the flow of hot, bouyant plume material. This process may explain the longlevity of cold, thick cratonic roots and the generation of kimberlites in crtons. We will use these methods to: a) predict the temporal and spatial distribution of adiabatic decompression melting and b) track the diamond/graphite stability field beneath and along the margins of the supeior craton, the world's largest, and the small tanzania craton, working in collaboration with n. Sleep. Initial lithospheric rhickness will be constrained by new and existing seismic, as well as zenolith, gravity, and heat flow data. These results will improve models for mineral exploration, as well as plume processes.
-
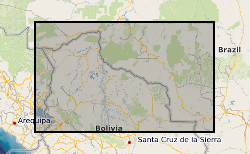
Between 1976 and 1982, the Overseas Directorate of the British Geological Survey, United Kingdom and the Geological Survey of Bolivia, Santa Cruz, carried out a major reconnaissance geological mapping, geochemical sampling and mineral exploration programme of that part of the Precambrian Brazilian Shield lying within eastern Bolivia. Previous geological work had been undertaken in the area, but this was the first time that a systematic and fully integrated survey had been attempted. The Project area is approximately 220,000 square kilometres and regional geochemical samples were collected from 8185 sites producing an overall sampling density of 1 sample per 27 square kilometres. Because of logistic problems it was impossible to sample certain inaccessible areas so the actual sampling density was 1 sample per 16 square kilometres for the 130,000 square kilometres effectively sampled. The geochemical samples were analysed in the Project laboratories in Santa Cruz and in the GEOBOL geochemical laboratories in La Paz. Uranium analyses were carried out by a commercial laboratory in the UK. The results of the Project are incorporated in 21 comprehensive reports in both English and Spanish. Twelve describe the geology, geochemistry and mineral potential of the individual 1:250,000 map areas and the remainder are devoted to the geology and mineral potential of areas of special geological or economic interest. The stream sediments were determined for: Ag, Co, Cu, Fe, Mn, Ni, Pb, Zn, As, U, B, Ba, Be, Cr, La, Li, Mo, Nb, Sn, Sr, Y, and Zr. These results are presented in an atlas as 22 single element 1:1 million scale, classed proportional symbol, point source data maps in which the symbols are overprinted on a simplified geological base map in order to facilitate rapid data interpretation. A 1:4 million scale moving average map based on a 4 x 4 km cell size and a 10 km search radius, printed alongside the symbol map, identifies the major regional variations. Raw data is available from the Geological Survey of Bolivia, Santa Cruz along with copies of the reports.
-

A set of 11 1:25 000 scale OS sheets annotated with the outcrops of the principal veins of the North Pennine Orefield, prepared as aids to the revision of the BGS Geology of the Northern Pennine Orefield memoir, vol. 1: Tyne to Stainmore, published in 1990. Some mining data are also included on the maps. The original data provided by Sir Kingsley Dunham were transcribed onto the 1:25 000 scale sheets to aid in adding grid references to the revised memoir. The data were mostly originally compiled from Dunham's detailed Second World War investigations of the orefield, together with some of Dunham's original 1930s PhD work. These records came from Geological Survey 'mining slips', which were on County Series sheets. For the 1990 revision of the memoir, new data were incorporated, derived from more recent mapping and a large volume of post-1940s mining and exploration data, together with the results of major advances in stratigraphical, structural, mineralogical and geochemical interpretations. The maps depict all of the major mineralised veins as black solid lines. The extent of replacement 'flat' orebodies are generally not shown, though the comparatively modest 'flats' associated with the Windshaw Bridge and Browngill veins at Tynebottom (sheet NY74) and the famous Boltsburn flats at Rookhope (sheet NY84/94) are indicated: the extent of the substantial area of 'flat' mineralisation around Nenthead is not depicted, almost certainly due to the difficulty of so doing due to the closely-spaced network of parent veins. Major, mostly un-mineralised, faults relevant to the descriptions and interpretations of the mineralisation are depicted as broken black lines. Other faults, depicted on BGS mapping, are not generally included. Only those details of mining, such as shaft and adit positions – shown in red by the use of standard BGS symbols – included on Dunham’s Mining Slips are recorded here. There are countless other shafts and adits across the orefield, some of which are mentioned in the memoir text but not depicted on these maps. Broken red lines depict significant underground cross-cut levels and drives which are described in detail in the memoir text. Countless others were not depicted by Dunham and are not shown here. Notes in red, copied from Dunham, are mostly self-explanatory and indicate the names of individual mines, shafts and adits. On his ‘Mining Slips’ Dunham made brief notes on some of the most obvious primary minerals he observed on some mine dumps. These are not included on these 1:25 000 scale maps. Many of these dumps have since become overgrown, and some have been removed. Reference to the ‘Mining slips’ may therefore be useful, though subsequent detailed mineralogical studies have revealed a much greater diversity of mineral species than was then recognised and which gives important clues to the nature and origins of the deposits. There is a rather extensive more recent literature on these.