 NERC Data Catalogue Service
Time series data
Type of resources
Available actions
Topics
Keywords
Contact for the resource
Provided by
Years
Formats
Representation types
Update frequencies
Service types
-
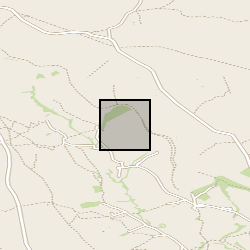
Long-period Magnetotelluric time series recorded in Jan to Feb 2022 at site NT91 near Alnham, England, UK (NT91). Funded by NERC, grant number: NE/V002694/1 "SWIMMR Activities in Ground Effects (SAGE)". These data consist of measurements of the Earth’s natural magnetic and electric field variations.
-
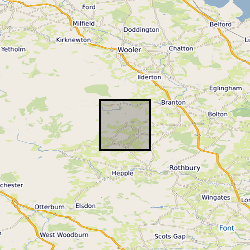
Long-period Magnetotelluric time series recorded in Jan to Feb 2022 at site NT91 near Alnham, England, UK (NT91). Funded by NERC, grant number: NE/V002694/1 "SWIMMR Activities in Ground Effects (SAGE)". These data consist of measurements of the Earth’s natural magnetic and electric field variations.
-
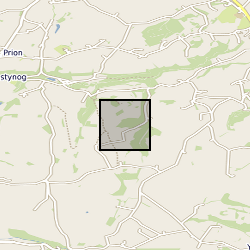
Long-period Magnetotelluric time series recorded in Jan to Feb 2022 at site NT91 near Alnham, England, UK (NT91). Funded by NERC, grant number: NE/V002694/1 "SWIMMR Activities in Ground Effects (SAGE)". These data consist of measurements of the Earth’s natural magnetic and electric field variations.
-
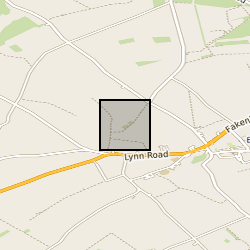
Long-period Magnetotelluric time series recorded in Jan to Feb 2022 at site NT91 near Alnham, England, UK (NT91). Funded by NERC, grant number: NE/V002694/1 "SWIMMR Activities in Ground Effects (SAGE)". These data consist of measurements of the Earth’s natural magnetic and electric field variations.
-
Monthly anomalies (August 2002 to July 2016) of total terrestrial water storage (TWS), soil moisture storage (SMS), surface water storage (SWS), snow water storage (SNS), groundwater storage (GWS) derived from an ensemble mean of 3 gridded GRACE products (CSR, JPL-Mascons and GRGS) and an ensemble mean 4 land surface models (CLM, NOAH, VIC and MOSAIC), provided by the NASA’s Global Land Data Assimilation System (GLDAS). Monthly precipitation (CRU) data, derived from the Climatic Research Unit (CRU), were aggregated over each aquifer system. GRACE, GLDAS and CRU datasets are publicly available at the global scale. (NERC grant NE/M008932/1)
-

We collect data from sensors located throughout the UK and beyond capturing information on properties such as groundwater temperature and levels, barometric air pressure and motion sensors. We have recently started collecting information related to the energy efficiency of buildings and have developed techniques for incorporating data from sensors operated by other institutions. Some of the data we collect is available through the sensor API and sensor dashboard which provides easy access to the API data.
-

Data generated by a range of scientific projects, including: UK Geoenergy Observatories in Glasgow & Cheshire: UK future energy monitoring and testing, Cardiff Urban Observatory: monitoring geothermal heat recovery and storage project, Seismic monitoring: a network of more than 100+ seismograph stations, River Thames ground water monitoring. BGS collect data from sensors located throughout the UK and beyond.
-
A range of hydraulics data including stages and discharges were collected for the River and Leat at Boxford between 01/04/2008 and 30/09/2014. The River Lambourn is a tributary of the River Thames, the principal river in the south-east of England. The CEH River Lambourn Observatory comprises a 600 m reach of river and 24 acres of associated water meadows at Boxford, Berkshire. Data include: 1. River flow gauging using Electro-magnetic Current Meter (ECM); 2. Leat flow gauging using Electro-magnetic Current Meter (ECM); 3. River flow gauging using Acoustic Doppler Current Profiler (ADCP); 4. River stage boards readings (eleven Stage boards); 5. Leat stage boards readings (six Stage boards); 6. River stage at water quality station (WQS) using Druck PDCR 1830 Submersible Pressure Transducer; 7. River stage at four stilling wells using SWS Technology Mini-Diver® Non-Vented Level Sensors with a built-in internal data logger (four locations); 8. Time series river discharges at Boxford which are calculated from the relationship obtained between discharge measurements taken monthly at Boxford using ADCP and total river discharges at Shaw gauging station; 9. Time series of the Leat discharges which are calculated from the relationship obtained between discharge measurements taken mo Full details about this dataset can be found at https://doi.org/10.5285/4ed6f721-b23b-454e-b185-02ba54d551f0