 NERC Data Catalogue Service
River flow
Type of resources
Available actions
Topics
Keywords
Contact for the resource
Provided by
Years
Formats
Representation types
Update frequencies
Resolution
-
This dataset reports the responses of annual river flow to forestation in 43 catchments and contains 770 data points. Data shows the change in river flow following forestation at annual time scales, along control river flow measurements and associated metadata from primary and secondary sources. Data collection, processing and interpretation were performed by Laura Bentley and David A. Coomes between January 2018 and October 2019. Forestation was defined as a change in land cover from a stable, non-forested state to a forested one, independent of the long-term history of forest cover. Paired measurements of annual river flow following forestation (mm) and river flow under control land cover conditions (mm) are provided for each year that the catchment dataset satisfied our inclusion criteria. River flow response is provided as both an absolute difference (mm) and as a percentage of control flow in the same year. Estimates of catchment annual precipitation, annual potential evapotranspiration, forest age, forest area, and the year of study are provided for each river flow response data point. Metadata are provided concerning catchment land cover history, land use history, catchment area, forest type, average climate and the method of forest establishment. The dataset contains catchments that were planted with trees and catchments in which forest cover regenerated without planting. Historical forest cover was reported in some catchments, and not reported in others. The 43 catchments a distributed unevenly across the globe, in 13 countries. The length of time series for each catchment varies from 2 years to 57 years, with and average duration of 19 years. Full details about this dataset can be found at https://doi.org/10.5285/5baa5d91-d552-4fc6-8a8c-29ae45192d77
-
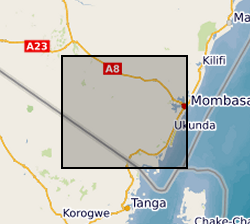
The data sets contain the rating curves and equations, approved stage (H) discharge (Q) data for the purposed of building river rating information for three hydrometric stations: 3KD06 and KISCOL weir on Mukurumudzi River and Eshu Bridge on Ramisi River, in Kwale. See also Wara et al. 2019: https://doi.org/10.4236/jwarp.2019.114028
-
This dataset is a model output, from the Grid-to-Grid hydrological model driven by observed climate data (CEH-GEAR rainfall and MORECS potential evaporation). It provides daily mean river flow (m3/s) for 260 catchments, for the period 1960 to 2015. The catchments correspond to locations of NRFA gauging stations (http://nrfa.ceh.ac.uk/). The data were produced as part of MaRIUS (Managing the Risks, Impacts and Uncertainties of drought and water Scarcity), which was a UK NERC-funded research project (2014-2017) that developed a risk-based approach to drought and water scarcity (http://www.mariusdroughtproject.org/). Full details about this dataset can be found at https://doi.org/10.5285/5f3c1a02-d5c4-4faa-9353-e8b68ce2ace2
-
This dataset is a model output, from the Grid-to-Grid hydrological model driven by observed climate data (CEH-GEAR rainfall and Oudin temperature-based potential evaporation). It provides daily mean river flow (m3/s) for 260 catchments, for the period 1891 to 2015. The catchments correspond to locations of NRFA gauging stations (http://nrfa.ceh.ac.uk/). The data were produced as part of MaRIUS (Managing the Risks, Impacts and Uncertainties of drought and water Scarcity), which was a UK NERC-funded research project (2014-2017) that developed a risk-based approach to drought and water scarcity (http://www.mariusdroughtproject.org/). Full details about this dataset can be found at https://doi.org/10.5285/0ceb4f85-0bbf-49f0-ab70-cfc137ab7d4d
-
This dataset is a model output, from the Grid-to-Grid hydrological model driven by observed climate data (CEH-GEAR rainfall and Oudin temperature-based potential evaporation). It provides monthly mean flow (m3/s) and soil moisture (mm water/m soil) on a 1 km grid for the period 1891 to 2015. To aid interpretation, two additional spatial datasets are provided: - Digitally-derived catchment areas on a 1km x 1km grid - Estimated locations of flow gauging stations on a 1km x 1km grid and as a csv file. The data were produced as part of MaRIUS (Managing the Risks, Impacts and Uncertainties of drought and water Scarcity), which was a UK NERC-funded research project (2014-2017) that developed a risk-based approach to drought and water scarcity (http://www.mariusdroughtproject.org/). Full details about this dataset can be found at https://doi.org/10.5285/f52f012d-9f2e-42cc-b628-9cdea4fa3ba0
-
This dataset is a model output, from the Grid-to-Grid hydrological model driven by observed climate data (CEH-GEAR rainfall and MORECS potential evaporation). It provides monthly mean flow (m3/s) and soil moisture (mm water/m soil) on a 1 km grid for the period 1960 to 2015. To aid interpretation, two additional spatial datasets are provided: * Digitally-derived catchment areas on a 1km x 1km grid * Estimated locations of flow gauging stations on a 1km x 1km grid and as a csv file. The data were produced as part of MaRIUS (Managing the Risks, Impacts and Uncertainties of drought and water Scarcity), which was a UK NERC-funded research project (2014-2017) that developed a risk-based approach to drought and water scarcity. Full details about this dataset can be found at https://doi.org/10.5285/e911196a-b371-47b1-968c-661eb600d83b
-
This dataset is a model output, from the Grid-to-Grid hydrological model driven by weather@home2 climate model data. It provides a 100-member ensemble of daily mean river flow (m3/s) for 260 catchments, for the following time periods: historical baseline (HISTBS: 1900-2006), near-future (NF: 2020-2049) and far-future (FF: 2070-2099). It also includes a baseline period (BS: 1975-2005). The catchments correspond to locations of NRFA gauging stations (http://nrfa.ceh.ac.uk/). The data were produced as part of MaRIUS (Managing the Risks, Impacts and Uncertainties of drought and water Scarcity), which was a UK NERC-funded research project (2014-2017) that developed a risk-based approach to drought and water scarcity. Full details about this dataset can be found at https://doi.org/10.5285/f6cac471-7d92-4e6d-be8a-9f7887143058
-

This image dataset was captured as part of the operation of a river gauging station on the Virkisá River, SE Iceland. The station formed part of the BGS Iceland Glacier Observatory network of sensors, deployed between 2009 and 2020 in order to characterise and identify glacial, geomorphological and hydrological drivers and processes and their timescales across the deglaciating Virkisjökull-Falljökull catchment in SE Iceland. The records presented here begin in September 2011 with the installation of the river gauging station, and continue to August 2020. Responsibility for the station passed to the Icelandic Meteorological Office in January 2018. The gauge is understood to remain operational as at August 2024. The data complements the published meteorological and river gauging datasets published here, and will be of use to researchers and students interested in the hydrology of a rapidly deglaciating landscape, including anyone interested to follow up on the various research studies published from this site in the international literature.
-
[THIS DATASET HAS BEEN WITHDRAWN]. Gridded hydrological model river flow estimates on a 1km grid over Northern Ireland for the period Dec 1980 - Nov 2080. The dataset includes monthly mean river flow, annual maxima of daily mean river flow (water years Oct - Sept), along with the date of occurrence, and annual minima of 7-day mean river flow (years spanning Dec-Nov), along with the date of occurrence (units: m3/s). The data are provided in gridded netCDF files. There is one file for each variable and ensemble member. To aid interpretation, two additional spatial datasets are provided: a) digitally-derived catchment areas and b) estimated locations of flow gauging stations both on the 1km x 1km grid and c) a 1km x 1km grid identifying majority lake cells. The data were produced as part of UK-SCAPE (UK Status, Change And Projections of the Environment, Work Package 2: Case Study - Water) a NERC-funded National Capability Science Single Centre award. Full details about this dataset can be found at https://doi.org/10.5285/7079d6e8-6184-4f80-89b4-4db924ec8b05
-
Gridded hydrological model river flow estimates on a 1km grid over Great Britain for the period Dec 1980 - Nov 2011. The dataset includes monthly mean river flow, annual maxima of daily mean river flow (water years Oct - Sept) and annual minima of 7-day mean river flow (years spanning Dec-Nov) (units: m3/s). The data are provided in gridded netCDF files. There is one file for each variable. To aid interpretation, two additional spatial datasets are provided: a) digitally-derived catchment areas and b) estimated locations of flow gauging stations both on the 1km x 1km grid. The data were produced as part of UK-SCAPE (UK Status, Change And Projections of the Environment; https://ukscape.ceh.ac.uk/, Work Package 2: Case Study - Water) a NERC-funded National Capability Science Single Centre award. Full details about this dataset can be found at https://doi.org/10.5285/2f835517-253e-4697-b774-ab6ff2c0d3da