 NERC Data Catalogue Service
2019
Type of resources
Available actions
Topics
Keywords
Contact for the resource
Provided by
Years
Formats
Representation types
Update frequencies
Scale
Resolution
-

Numerical model predictions of present-day horizontal deformation due to ongoing glacial isostatic adjustment processes at GPS sites across Antarctica. Model accounts for 3D spatial variations in Earth rheology using a finite element approach.
-
Processed SAR interferograms for the Wells, Nevada earthquake. Grant abstract: How do earthquakes happen? Understanding the nature of earthquakes is a key fundamental question in Geociences that holds many implications for society. Earthquakes are typically associated with a sudden release of energy that has slowly accumulated over hundreds to thousands of years, being strongly controlled by friction in faults buried several kilometers beneath our feet under quite extreme conditions. For example, the amount of heat produced in just a few seconds is such that it can dramatically change the nature of the fault zone near the sliding surface. Moreover, there is abundant evidence of substantial frictional weakening of faults (i.e., fault strength weakens with increasing slip or slip rate) during earthquakes. However, there are still many open questions related to earthquake source processes: How similar are earthquakes in different temperature-pressure conditions? What is the earthquake's energy budget, which controls the intensity of ground motions? What are the physical mechanisms responsible for fault weakening? Recent progress in seismological imaging methods, theoretical fracture mechanics and rupture dynamics simulations can help solve these questions. Huge volumes of freely available seismic and geodetic data from around the world now allow the routine calculation of earthquake models where earthquakes are typically described as single space-time points. Time is now ripe for systematically building robust, more detailed seismic models bearing information on earthquake's physics by using recently developed sophisticated modelling tools along with high-quality images of the 3-D Earth's interior structure enabled by high performance computing facilities. Moreover, it is now possible to model ruptures theoretically in detail using both analytical fracture mechanics calculations and numerical rupture dynamics simulations, and, for example, estimate the fault temperature during the rupture process, which is the most direct way to quantify friction. However, systematic quantitative links between these calculations and seismological observations are still lacking. This project addresses these issues through a coordinated effort involving seismology and rock mechanics aiming at estimating fault temperature rise during earthquakes from new macroscopic seismic source models. We will use advanced seismic source imaging methods to build a new set of robust kinematic, static and dynamic earthquake source parameters for a large selected set of global earthquakes (e.g., average fault length, width, rupture speed and time history, stress drop, radiated and fracture energy). These solutions will then be used as input parameters to estimate fault temperature using analytical and numerical rupture dynamics calculations. This will lead to an improved understanding of how local fault processes occurring at scales from few microns to tens of centimetres translate into macroscopic seismological properties, how energy is partitioned during earthquakes and which are the mechanisms responsible for fault weakening. Ultimately this project will shed new light on many basic questions in earthquake science such as the similarity of earthquakes in different P-T conditions and the potential geological record left by ruptures (e.g., melt). More broadly, this project will benefit hazard models and any studies relying on accurate earthquake source parameters such as studies in seismic tomography, active tectonics and microseismicity (e.g., associated with hydraulic fracturing).
-
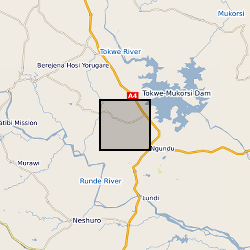
These files include hydrochemical data and groundwater level time series for a number of boreholes and wells within the basement aquifers of the Romwe catchment. For each borehole/well there are associated depth, geology and use data. A time series study of abstraction was also carried out for a subset of wells. Time series rainfall data for a rain gauge in the catchment is also included. These data were collected through a series of projects: Small scale irrigation using collector wells: pilot project (CEH/BGS/Zimbabwe Ministry of Lands, Agriculture and Water Development; DfID funded) Sustainability of yield from wells and boreholes in hard rock aquifers (BGS; DfID funded) Regional groundwater recharge assessment in semi-arid areas (CEH/BGS; DfID-funded) The Hydrology of a dry land catchment in southern Zimbabwe, and the effects of climatic and land use change on shallow groundwater resources (PhD project, Uni. Reading/CEH) Integrated Catchment Management and Sustainable Water Resource Development in Semi-arid Zimbabwe (PhD project, Uni. Reading/CEH) Note: CEH (Center of Ecology and Hydrology) was known as ‘IH’ during the period of the study
-
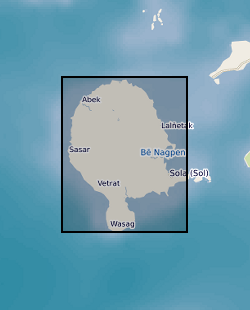
The files contain backscattered (BSE) SEM images and photomicrographs of studied samples form Vanua Lava, Vanuatu (New Hebrides). The samples are mantle xenolith found in situ in lava boulders.
-
The 5km Hex GS Landslides dataset shows a generalised view of the GeoSure Landslides v8 dataset to a hexagonal grid resolution of 64.95km coverage area (side length of 5km). This dataset indicates areas of potential ground movement in a helpful and user-friendly format. The rating is based on a highest level of susceptibility identified within that Hex area: Low (1), Moderate (2), Significant (3). Areas of localised significant rating are also indicated. The summarising process via spatial statistics at this scale may lead to under or over estimation of the extent of a hazard. The supporting GeoSure reports can help inform planning decisions and indicate causes of subsidence. The methodology is based on the BGS Digital Map (DiGMapGB-50) and expert knowledge of the behaviour of the formations so defined. This dataset provides an assessment of slope instability. Landslide hazard occurs due to particular slope characteristics (such as geology, gradient, sources of water, drainage, man-made constructions) combining to cause the slope to become unstable. Downslope movement of materials, such as a landslide or rockfall may lead to a loss of support and damage to buildings. Complete Great Britain national coverage is available.
-

The data are associated with a paper entitled 'Widespread tephra dispersal and ignimbrite emplacement from a subglacial volcano (Torfajökull, Iceland)' by J Moles et al. (2019). See paper for full details. Data types: major element geochemistry; trace element geochemistry; 40Ar/39Ar geochronology. Table DR9 contains EPMA data of proximal lavas and ignimbrite fiamme. Table DR10 contains EPMA data of ash shards. Table DR11 contains EPMA standard data. Table DR12 contains LA-ICP-MS data of proximal lavas and ignimbrite fiamme. Table DR13 contains LA-ICP-MS data of ash shards. Table DR14 contains LA-ICP-MS standard data (raw). Table DR15 contains LA-ICP-MS standard data (corrected). Table DR16 contains 40Ar/39Ar geochronology data.
-

Low-resolution Paleogene bulk sediment stable oxygen and carbon isotope data from IODP Expedition 369, Sites U1514 and U1516 in the SE Indian Ocean.
-
Data from laboratory experiments conducted as part of project NE/K011464/1 (associated with NE/K011626/1) Multiscale Impacts of Cyanobacterial Crusts on Landscape stability. Soils were collected from two sites in eastern Australia and transferred to a laboratory at Griffith University, Queensland for conduct of experiments. Soils were A, a sandy loam, and B a loamy fine sand. Trays 120 mm x 1200 mm x 50 mm were filled with untreated soil that contained a natural population of biota. Soils were either used immediately for experiments (physical soil crust only: PC) or were placed in a greenhouse and spray irrigated until a cyanobacterial crust has grown from the natural biota. Growth was for a period of 5 days (SS), c.30 days (MS2) or c.60 days (MS1). Following the growing period (if applicable) trays were placed in a temperature/humidity controlled room at 35° and 30% humidity until soil moisture (measured 5 mm below the surface) was 5%. Trays were then subject to rainfall simulation. Rainfall intensity of 60 mm hr-1 was used and rainfall was applied for 2 minutes (achieving 2 mm application), 8 minutes (achieving 8 mm application) or 15 minutes (achieving 15 mm application). Following rainfall, trays were returned to the temperature/humidity-controlled room under UV lighting until soil moisture at 5 mm below the surface was 5%. A wind tunnel was then placed on top of each tray in turn and a sequential series of wind velocities (5, 7, 8.5, 10, 12 m s-1) applied each for one minute duration. On each tray the five wind velocities were run without saltation providing a cumulative dust flux. For the highest wind speed, an additional simulation run was conducted with the injection of saltation sands. Three replicates of each rainfall treatment were made. Variables measured include photographs, spectral reflectance, surface roughness, fluorescence, penetrometry, chlorophyll content, extracellular polysaccharide content, Carbon, Nitrogen and splash erosion and particle-size analysis (of wind eroded material). Details of rainfall simulator, growth of cyanobacteria, laser soil surface roughness characterisation and wind tunnel design and deployment in Strong et al., 2016; Bullard et al. 2018, 2019. Bullard, J.E., Ockelford, A., Strong, C.L., Aubault, H. 2018a. Impact of multi-day rainfall events on surface roughness and physical crusting of very fine soils. Geoderma, 313, 181-192. doi: 10.1016/j.geoderma.2017.10.038. Bullard, J.E., Ockelford, A., Strong, C.L., Aubault, H. 2018b. Effects of cyanobacterial soil crusts on surface roughness and splash erosion. Journal of Geophysical Research – Biogeosciences. doi: 10.1029/2018. Strong, C.S., Leys, J.F., Raupach, M.R., Bullard, J.E., Aubault, H.A., Butler, H.J., McTainsh, G.H. 2016. Development and testing of a micro wind tunnel for on-site wind erosion simulations. Environmental Fluid Mechanics, 16, 1065-1083.
-

The data are magnesium (Mg) isotope composition, i.e. the relative difference of isotope ratios as defined in Coplen (2011, doi: 10.1002/rcm.5129). The reference was DSM-3 (see Galy et al., 2003, doi: 10.1039/b309273a) and data are given in per mil. Samples consisted of terrestrial peridotites and basalts as well as a suite of meteorites including chondrites, shergottites, diogenites and one angrite. A large portion of the data have been published in Hin et al. (2017, doi: 10.1038/nature23899).
-

Sediment % coarse fraction (>63 microns), and abundance of fish teeth in coarse fraction. 2016 has been a record breaking year in terms of global temperatures. The high temperatures have resulted from a combination of elevated atmospheric pCO2 coupled with the global impacts of a strong El Nino event. There are many important components of the climate system, and the El Nino phenomenon demonstrates the importance of the low latitude Pacific Ocean. The warm pool of water in the western Pacific Ocean has not always had the same characteristics as it has today, and it has been proposed that its evolution over the past 15 million years has had a major impact on global climate. In order to understand how the warm pool might respond to future climate change, it is important to understand the drivers behind its past evolution. Did it respond simply to the changing shape of ocean basins through time? Or did it respond to other components of the climate system, such as sea level or latitudinal temperature gradients? The changes in warm pool structure may also have impacted the biological ecosystems, and hence the cycling of carbon in this region. The carbon cycle is another key component of the Earth's climate system. Understanding the causes and consequences of these long-term changes in the Pacific warm pool requires a two-pronged approach, using modelling in conjunction with proxy records for different parts of the climate system. This proposal aims to generate some key records of past high latitude temperature and ice volume that can be directly compared with changes in the warm pool through time. These records will be derived from geochemical analyses of microscopic marine fossils collected by the International Ocean Discovery Program (IODP).