 NERC Data Catalogue Service
Shapefile
Type of resources
Available actions
Topics
Keywords
Contact for the resource
Provided by
Years
Formats
Representation types
Update frequencies
Scale
Resolution
-
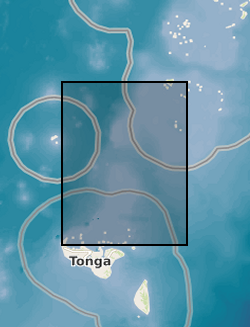
Tsunami trimlines identified across different islands of the Tonga archipelago. Trimlines have been used as a reference land feature following the January 2022 Tonga tsunami event that ripped off vegetation and built-up areas. Trimlines are distinctive limits between an area with sand coverage, vegetation destruction, and soil erosion on the one hand, and the unaffected natural vegetation on the other. This distinction provides a good landmark to map the inundation width and the landward extension of tsunami runup. In this case, the trimlines have been manually delineated by BGS - Earth Observation team using different high-resolution satellite datasets both optical (KompSat, Planet, Pleiades, WorldView) and radar (TerraSAR-X). Trimlines are well known from task-force publications documenting recent tsunami detection efforts and provide key information to support tsunami triggering mechanism models. For more info, see https://www.usgs.gov/media/images/tsunami-terms and Scheffers et al. (2012), https://doi.org/10.1007/s11069-010-9691-6
-
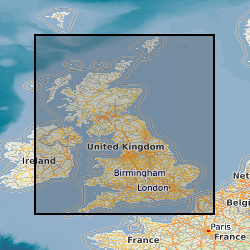
This dataset is a characterisation of discontinuity types found within rocks and soils in Great Britain. Discontinuities are breaks, fractures or planes of weakness in the rock mass. The dataset includes type, frequency and orientation of discontinuities within rock and soil materials at formation (local to regional) scale. The discontinuities are classified in 3 categories: stratification (bedding planes), foliation (mineral banding) and rock mass description. The dataset aims to facilitate the preliminary research for planning and design of buildings, infrastructure and resource extraction. It forms part of the DiGMap Plus dataset series of GIS layers which describes the engineering properties of materials from the base of pedological soil down to c. 3m depth (ie the uppermost c.2m of geology). These deposits display a variable degree of weathering, but still exhibit core engineering characteristics relating to their lithologies.
-
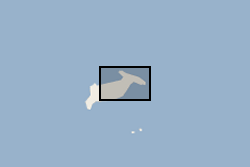
Waterlines have been extracted to delimit the edge of the Hunga Tonga - Hunga Ha'apai island between April 2017 and April 2022. Waterline is defined as the instantaneous land - water boundary at the time of the imaging process. Waterlines have been generated by BGS - Earth Observation team through a thresholding-based classification based on Sentinel-2 multispectral imagery and developed on Google Earth Engine. Specifically, the thresholding has been applied to the Normalized Difference Water Index (NDWI) has been derived as a basis to discriminate between the land and sea based on their spectral characteristics. Changes in waterlines over volcanic islands can provide key information to understand volcanic processes. For more info on the methodology, see Novellino et al. (2020) https://doi.org/10.3390/app10020536
-

This dataset is a characterisation of the soil and rocks and the potential bulking factor (likely excavated volume increases) at Formation (local to regional) level for Great Britain. The data is categorised into Class, characteristics of similar soils and rocks and Bulking Factor, range or ranges of % bulking. The excavation of rocks or soils is usually accompanied by a change in volume. This change in volume is referred to as ‘bulking’ and the measure of the change is the ‘bulking factor’. The bulking factor is used to estimate the likely excavated volumes that will need to be moved, stored on site, or removed from site. It is envisaged that the 'Engineering Properties: Bulking of soils and rocks' dataset will be of use to companies involved in the estimation of the volume of excavated material for civil engineering operations. These operations may include, but are not limited to, resource estimation, transportation, storage, disposal and the use of excavated materials as engineered fill. It forms part of the DiGMap Plus dataset series of GIS layers which describe the engineering properties of materials from the base of pedological soil down to c. 3m depth (ie the uppermost c.2m of geology). These deposits display a variable degree of weathering, but still exhibit core engineering characteristics relating to their lithologies.
-
This dataset contains the areas affected by landslides triggered by Typhoon Parma in the area of Itogon (Benguet, Philippines) between the 2nd and 5th October 2009. The polygons were mapped using Google Earth imagery dated 31 December 2003 for pre-event and images and 31 December 2009 for post-event images. The area has an extension of 150 km2. Full details about this dataset can be found at https://doi.org/10.5285/2e15dbd2-71c3-4e86-aa90-6029d37bd417
-
This dataset records the Saiga antelope die-off and calving sites in Kazakhstan. It represents the locations (and where available dates) of (i) die-offs and (ii) normal calving events in the Betpak-dala population of the saiga antelope, in which three major mass mortality events have been recorded since 1988. In total, the data contains 214 saiga die-off and calving sites obtained from field visits, aerial surveys, telemetry and literature. Locations derived from field data, aerial surveys or telemetry are polygons representing the actual size and shape of the die-off or calving sites; locations sourced from the literature are point data around which buffers of 6km were created, representing the average size of calving aggregations. Of the 214 locations listed, 135 sites for which environmental data were available were used to model the probability of a die-off event. The collection and use of these data are written up in more detail in papers which are currently under review (when published links will be added to this record). Saiga antelope are susceptible to mass mortality events, the most severe of which tend to be caused by haemorrhagic septicaemia following infection by the bacteria Pasteurella multocida. These die-off events tend to occur in May during calving, when saigas gather in dense aggregations which can be represented spatially as relatively small sites. The Betpak-dala population is one of three in Kazakhstan, located in the central provinces of the country (see map). Full details about this dataset can be found at https://doi.org/10.5285/8ad12782-e939-4834-830a-c89e503a298b
-
This data set provides a spatial stratification of forest cover into discrete vegetation classes according to the High Carbon Stock (HCS) Approach. The data set covers the Stability of Altered Forest Ecosystems (SAFE) project site located in Sabah, Malaysian Borneo. Data were collected in 2015 during a project which was included in the NERC Human-modified tropical forest (HMTF) programme. Full details about this dataset can be found at https://doi.org/10.5285/81cad1ef-b5cc-4592-a71f-204a5d04b700
-
This dataset consists of a vector layer (based on 1 by 1° grid), of modelled surface ozone concentrations (ppb). The values per cell are daily mean surface ozone for the period 6am – 6pm. The seasonal average has been calculated for the grassland growing season, for the period spanning mid-April to mid-July, for the UK and the USA, for 2018. Full details about this dataset can be found at https://doi.org/10.5285/4b0871a9-196a-48e1-a0c8-c5f53e17e9a7
-
This dataset includes polygons representing ecosystem types (ET) and their respective ecosystem services (ES) and disservices (EDS) in the Luanhe River Basin, with attributes recording 14 ecosystem types (ET), 11 provisioning services (PS), ten regulating services (RS), five cultural services (CS), 7 Ecological integrity indicators (EI), and 11 ecosystem disservices (EDS). Full details about this dataset can be found at https://doi.org/10.5285/2252d8a4-0ef3-403f-b2c3-3f7acbcac1d5
-
A Yield Constraint Score (YCS; scale of 1-5) was developed for the effect of five key crop stresses (ozone, pests and diseases, soil nutrients, heat stress and aridity) on the production of the crops maize (Zea mays), rice (Oryza sativa), soybean (Glycine max) and wheat (Triticum aestivum). Data are on a global scale at 1 deg by 1deg resolution, based on the distribution of production for each crop, according to the Food and Agriculture Organisation’s (FAO) Global Agro-Ecological Zones (GAEZ) crop production data for the year 2000. To derive the YCS for each crop stress, spatial data on a global scale were gathered. Modelled ozone data (2010-2012) were derived from the EMEP MSC-W (European Monitoring and Evaluation Programme, Meteorological Synthesising Centre-West) chemical transport model (version 4.16). Pests and diseases data (2002-2004) were downloaded from a Centre for Agriculture and Biosciences International (CABI) database providing estimates for pre-harvest crop losses due to weeds, animal, pathogens and viruses, compiled from the literature. Soil nutrient classifications (for 2009, derived using soil attributes from the Harmonized World Soil Database (HWSD)) were downloaded from the GAEZ data portal. A heat stress index was calculated using daily temperature data (1990-2014) to determine whether the temperature within a 30-day thermal-sensitive period exceeded crop tolerance thresholds. Global Aridity Index data (1950-2000) were downloaded from the Consultative Group for International Agricultural Research’s Consortium for Spatial Information (CGIAR-CSI). The Yield Constraint Score provides an indication of where each stress is predicted to be affecting crop yield globally and the magnitude of the effect. The YCS data were developed as part of the NERC funded SUNRISE project and the National Capability Project NC-Air quality impacts on food security, ecosystems and health. Full details about this dataset can be found at https://doi.org/10.5285/d347ed22-2b57-4dce-88e3-31a4d00d4358