 NERC Data Catalogue Service
Water resources
Type of resources
Topics
Keywords
Contact for the resource
Provided by
Years
Representation types
Update frequencies
-
The data are transcripts of qualitative community surveys carried out in Amuria (A) and Katakwi (K) districts, north-eastern Uganda, as part of a pilot project looking at causes of borehole/hand pump failure in rural areas. The community survey was designed to collected basic information on community water use, reconstruct the history of the water point and explore the socio-institutional factors that may have contributed to non-functionality. Key topics included: community engagement in planning and construction of the water point, access to the water point (and alternative water sources), water quality and yield (including seasonality), mechanical failures and repairs, water point management and by-laws, and fees and finances. The survey took the form of a semi-structured group discussion, guided by a set of questions covering the key topics. Each survey took 2-3 hours. Surveys were conducted for 24 water points. Participants included both water users and Water Point Committee (WPC) members. There were no restrictions on who from the community could participate in the discussion, hence numbers varied. The focus groups were facilitated by local NGO staff familiar with the districts, and guided by researchers from the Overseas Development Institute. The transcripts were produced from the detailed handwritten notes taken by the researchers during the group discussions, with the support of translators. The community surveys should be viewed as complementary to the technical investigations conducted at the borehole.
-
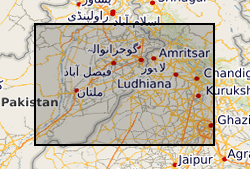
The groundwater systems of northwest India and central Pakistan are amongst the most heavily exploited in the world. Groundwater has been monitored in the region for more than a century resulting in a unique long-term record of groundwater level change. The BGS has compiled groundwater level data from northwest India (Haryana and Punjab) and Pakistan (Punjab) between 1884 and 2020. The dataset, presented here, was compiled from various sources between 2018 and 2020. The excel file consists of two tabs both containing groundwater level data (in metres below ground level) and location information. In the first tab (Full_dataset), which contains the full dataset, there are 68783 rows of observed groundwater level data from 4028 individual sites. In the second tab (LTS) there are 7547 rows of groundwater level observations from 130 individual sites, which have water level data available for a period of more than 40 years and from which at least two thirds of the annual observations are available.