 NERC Data Catalogue Service
Side scan sonar
Type of resources
Available actions
Topics
Keywords
Contact for the resource
Provided by
Years
Formats
Representation types
Update frequencies
Service types
-

Three datasets, ground-penetrating radar, side-scan sonar and sub-bottom profile data (CHIRP), were collected in April and June 2022 from the proximal Skeiðarársandur area (~63.9 N, 17.2 E) and Skeiðarársandur coastline (63.7 N, 17.5 E) that lie at the mouth of Gígjukvísl. Ground-penetrating radar (GPR) data acquired for this project on 15th and 18th April 2022 provide new insights into the sediment architecture of differing depositional environments at Skeiðarársandur, southeast Iceland, including: (i) a recently emplaced jökulhlaup deposit in a large ice-proximal depression, and (ii) the coastal environment of a vast glaciofluvial braidplain. Radar data collected in the ice-proximal depression utilised a 250 MHz Utsi GroundVue (GV) 3, a shielded single-channel bistatic radar system suited to near surface (0-10 m depth). Approximately 30 km of 250 MHz GPR data were collected parallel and perpendicular to the jökulhlaup flow direction. The GPR data from the coastal regions of Skeiðarársandur were collected using a 100 MHz Utsi GV7. The 100 MHz Utsi GV7 is a ruggedised and unshielded radar system with a centre-frequency of 100 MHz and an emitted bandwidth of ~1-160 MHz. The radar system has a maximum time-window of 800 ns and each stacked radar trace is comprised of 256 samples (i.e. one sample every 3.125 ns). Approximately 12 km of 100 MHz radar data were collected at the Skeiðarársandur coastline. File format for the raw data includes .dat, .gps, .gpt and .hdr. Positional (Lat, Lon) data were acquired using a handheld GPS connected via USB to the ruggedised laptop (100 MHz Utsi GV7) or connected directly to GPR control unit (250 MHz Utsi GV3). All GPS data were recorded directly in the Utsi GroundVue software by logging an NMEA string concurrent with radar trace samples (i.e. an XY position for each individual sampled radar trace). Side scan sonar, CHIRP and single-beam echosounding data were collected within a large proglacial lake fronting Skeiðarárjökull (63.5 N, 16.3 W) between 11th to 24th June. Side scan data was acquired using an AquaScan Precision Side Scan Sonar System. During surveys the tow fish was lowered to a constant relative position and depth below the boat hull. This data provides an imaging of the lakebed which is used for qualitative description of lakebed features (filed are .xtf). A hull mounted Sonarmite BTX single-beam echosounder was used to provide depth control which was linked via Bluetooth a hull mounted Leica GS14 (.txt files). Sub bottom data was acquired using Bathy 2010PC CHIRP Sub Bottom Profiler operating at dual frequency (3.5KHz and 10.0KHz). This was towed alongside the boat and used to constrain lakebed depth as well as buried sediment architecture. Ping rate varied based on depth of returns. Raw data was collected at .seg files. All lake survey data is georeferenced using GNSS data from boat mounted Leica GS14 receiving real-time corrections from a base station over a known location.
-
These data comprise four phases of geophysical survey carried out in 2002, 2007, 2008 and 2011, covering various areas within the Thames Estuary as part of an overarching archaeological investigation called the London Gateway project (2001-2020) ahead of planned dredging works. 88635_49575_2002 - Area of sidescan sonar data within the Thames Estuary (shell haven) area. The data were acquired in OSGB36 British National Grid coordinates and covers the area: Top Left - 570395.312500 E, 183444.953125 N, Top Right - 604097.250000 E, 183444.953125 N, Bottom Right - 604097.250000 E, 177590.140625 N, Bottom Left - 570395.312500 E, 177590.140625 N. 88635_61207_2007 - Geophysical survey comprising sidescan sonar data acquired over 13 separate wreck sites. Corresponding MBES data were acquired previously in 2005 and are deposited with the UKHO. SSS data comprise a total of 83 .xtf files with 2 channels. Acquired in WGS84 UTMz31N coordinates. 400 KhZ frequency. Range 50 m. Sensor positions rather than ship positions for each line in metadata. Each wreck location is centred on (UTMz31N): Amethyst - 364468 E, 5708659 N; Ancient - 325490 E, 5708230 N; Argus - 359499 E, 5706071 N; Ash - 360905 E, 5706497 N; Atherton - 359708 E, 5706186 N; Dynamo - 401449 E, 5743755 N; EastOaze - 362786 E, 5707385 N; ErnaBoldt - 403551 E, 5746997 N; Letchworth - 357544 E, 5705592 N; London - 343115 E, 5707365 N; Pottery - 346619 E, 5706276 N; SS Storm - 406001 E, 5747115 N; Unknown wreck - 375530 E, 5714052 N. 88635_61208_2008 - Geophysical survey comprising sidescan sonar and multibeam echosounder data over a single wreck site. SSS data comprise a total of 7 .xtf files with 2 channels. 400 KhZ frequency. Range 50 m. Acquired in WGS84 Geographic coordinates. Sensor positions rather than ship positions for each line in metadata. Wreck location in WGS84 UTMz31N: Aisha - 363982 E, 5707656 N. 88635_79800_2011 - Geophysical survey comprising magnetometer, sidescan sonar and multibeam echosounder data undertaken over three separate blocks; Area 9to11, Area 26to36 and Area 105. Area9to11:332980 E, 5708675 N; 332980 E, 5708226 N; 338586 E, 5707813 N; 338681 E, 5708242 N. Area26to36:339693 E, 5708096 N; 339571 E, 5707680 N; 345670 E, 5706229 N; 350490 E, 5706371 N; 350338 E, 5706838 N; 345680 E, 5706685 N. Area105:383734 E, 5719704 N; 384035 E, 5719369 N; 385920 E, 5720804 N; 385619 E, 5721134 N. Where corresponding multibeam echosounder data were acquired, these data have been archived with the United Kingdom Hydrographic Office (UKHO). Overarching full archaeological investigation, including results of the assessment of these data, and technical reports are archived with the Archaeology Data Service (ADS) (https://doi.org/10.5284/1083494).
-
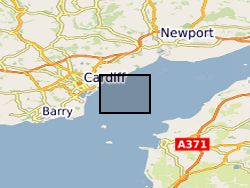
MEDIN Data. Within the project (WFA-CPC EMFF Protecting Our Seas), benthic and geophysical surveys were undertaken in the Severn Esturary/Môr Hafren SAC to explore the location of Sabellaria alveolata reefs, and collected bathymetry, sidescan sonar, AGDS and acoustic imagery data (ARIS) to identify areas of variable ground or potential features. A ten-day survey was undertaken in July 2020 to collect broad-scale acoustic data using an interferometric swath bathymetric system (GeoSwath Plus) and Acoustic Ground Discrimination System (RoxAnn™ AGDS). Twelve secondary survey areas were selected to be investigated in greater detail using high frequency sidescan sonar and an Acoustic Resonance Inspection System (ARIS Explorer 3000) camera in a second ten-day survey conducted in August 2020 (https://www.envision.uk.com/wp-content/uploads/2022/03/2018-1008-NRW-WFA-Protecting_Our_Seas_Final_Report_20210201.pdf) The data sets include: SSS (.tif) collected using Trident SeaStar MBES (.xyz) collected using GeoSwath Plus, AGDS (.csv and .asc) collected using RoxAnn™ AGDS ARIS imagery (.png and .mp4) collected using ARIS Explorer 3000 camera Shapefiles (.shp etc)
-

This Web service provides layers which show data relating to offshore survey activities undertaken by the British Geological Survey (BGS) and its predecessors. The layers are polygon, line and point layers which indicate the spatial areas of survey activities. The survey overview layer shows the location and basic information for coastal and marine surveys. It includes information about the survey, including the types of equipment deployed during the survey. For some surveys, a zip file of additional data can be downloaded using the URL link provided where available. The geophysical surveys layers show survey lines and shot points along those lines, where applicable. Geophysical surveys include shallow seismic reflection (e.g. airgun, boomer, pinger, sparker and water gun) and sonar (e.g. echo sounder, sidescan sonar and transit sonar). There may be several types of equipment deployed on a single survey line. Survey lines are uniquely named with a survey and line identifier (name or number). For example, 1985/6#16 is line 16 of survey 1985/6. The lines layer includes seismic reflection (sub seabed imaging which provides information about structures below the seabed) and sonar (seabed imaging which provides information about the roughness of the seabed or simple bathymetric data). Links to scanned images of geophysical records are provided (where available) for openly available survey lines where terms of use are known. The backscatter layer shows the location and basic information for bathymetric surveys containing backscatter data. A zip file of the backscatter image files for the survey can be downloaded using the URL link provided. Note that there can be more than one polygon per survey and these will link to the same zip file for the entire survey. The majority of the data were collected and processed for the Maritime and Coastguard Agency (MCA) under the Civil Hydrography Programme. To download the related bathymetry data go to the Admiralty Marine Data Portal (https://datahub.admiralty.co.uk/portal/apps/sites/#/marine-data-portal). The oil and gas industry site surveys layer shows the geographic location of oil and gas industry site surveys. The metadata for these surveys were collated via the BGS MEDIN Data Archive Centre (DAC). BGS do not hold the data. For further information contact the custodian of the data. For more information, contact BGS Marine Enquiries (offshoredata@bgs.ac.uk).