 NERC Data Catalogue Service
Seismicity
Type of resources
Available actions
Topics
Keywords
Contact for the resource
Provided by
Years
Formats
Representation types
Update frequencies
Scale
-

"This data was compiled for the paper "Self-similarity of seismic moment release to volume change scaling for volcanoes: a comparison with injection-induced seismicity", that has been accepted for publication in Geophysical Research Letters. It is a compilation of literature values of volume changes and associated total seismic moment releases for many injection-induced earthquake sequences. It also includes a number of total moment releases and volume changes from volcanic sequences that were calculated for the study from published earthquake catalogues. This work was conducted to examine the response of the shallow crust to volume changes in the two different contexts, make the comparison between them, and discuss why the response is similar or dissimilar. The data consists of two tables. For the fluid injection data the table lists the project name, the approximate dates, the source, the type of operation, and naturally the volume and total seismic moment release. For the volcanotectonic sequences, it lists the name of the eruption/intrusion, the dates, volume change, and moment release. Also included in both tables are the seismic efficiency (functionally the ratio of moment releasee to volume change, see Hallo et al., 2014) and seismogenic index (another measure of the response of the crust to a volume change, see Shapiro et al., 2010). Aki, K. (1965). Maximum likelihood estimate of b in the formula log N = a-bM and its confidence. Bulletin of Earthquake Research Institute of the University of Tokyo, 43, 237–239. Cao, A., & Gao, S. S. (2002). Temporal variation of seismic b -values beneath northeastern Japan island arc Geophysical Research Letters, 29(9), 48-1-48–3. https://doi.org/10.1029/2001gl013775 Hallo, M., Oprsal, I., Eisner, L., & Ali, M. Y. (2014). Prediction of magnitude of the largest potentially induced seismic event. Journal of Seismology, 18(3), 421–431. https://doi.org/10.1007/s10950-014-9417-4 Shapiro, S. A., Dinske, C., Langenbruch, C., & Wenzel, F. (2010). Seismogenic index and magnitude probability of earthquakes induced during reservoir fluid stimulations. Leading Edge, 29(3), 304–309. https://doi.org/10.1190/1.3353727 "
-

This dataset is a catalogue of elastic stress models of hydraulic fracturing during the 2018 Preston New Road, PNR-1z operations (described in Clarke et al., 2019). This modelling was produced for the publication Kettlety et al. (2020), which studies the physical mechanisms controlling seismicity during hydraulic fracturing. For further details on the modelling approach and context for these data, see Kettlety et al. (2020) and the README file attached here.This is a combined microseismic catalogue of all of the seismic magnitudes recorded for microseismic events recorded during Cuadrilla's Preston New Road hydraulic fracturing operations. 5 magnitude types are given for each event: the downhole measured moment magnitude (Mw); the downhole measured local magnitude (ML); the surface measured ML; the surface measured Mw; and a combined/corrected Mw. This corrected Mw follows the procedure laid out in Kettlety et al. (2021, https://doi.org/10.1785/0220200187) and Baptie et al. (2020, Robust relationships for magnitude conversion of PNR seismicity catalogues. British Geological Survey Open Report, OR/20/042) Functionally, it combines the surface measured Mw and the downhole measured Mw corrected using Equations 4.6 and 4.7 of Baptie et al. (2020). Also included are event origin times, associated injection stages (as described in Clarke et al., 2020, https://doi.org/10.1785/0220190110, and Kettlety et al., 2021), whether this stage was a "minifrac" (just for PNR-1z), the "relative fracture order" (RFO) of that stage, and it's downhole measured location (easting and northing in BNG coordinates, and depth BSL). Downhole measurements Mw and ML were conducting by Schlumberger Ltd. on behalf to the Preston New Road operator Cuadrilla Resources Ldt., and surface ML and Mw were measured by the BGS in Baptie et al., (2020).
-

Field and microstructural analysis of pseudotachylytes formed at lower crustal depths and now lying exposed in the Flakstadøy Anorthosite, Lofoten, Norway. Electron backscatter diffraction (EBSD) analysis : 10 EBSD datasets (cpr files) - unfiltered. These characterise deformation in pyroxenes spatially associated with pseudotachylyte faults in the Nusfjord anorthosite. Grain size analysis - backscattered electron (BSE) images and processed equivalents (segmented manually or with ImageJ software) of fragmented orthopyroxene for grain size analysis. Results are processed in the spreadsheet 'Grain size distributions for fragmented OPX'. Samples involved: LC1724 and N22 Grain growth modelling - spreadsheet calculating grain growth rates for orthopyroxene in samples LC1724 and N22 Strain analysis - used to estimate strain via clast analysis of mylonitised pseudotachylyte, sample 269c
-

This data set contains seismic source parameters (magnitudes, corner frequencies, stress drops and their associated uncertainty) for 94 microseismic events linked to fault reactivation during hydro-fracturing operations in the Horn River Basin (British Columbia). The data presented here were derived from proprietary third party seismic data recorded on 2 arrays of 35 - 15 Hz GEO-OMNI-2400 borehole geophones each. These data were first reported in Adam G Klinger, Maximilian J Werner, Stress drops of hydraulic fracturing induced microseismicity in the Horn River basin: challenges at high frequencies recorded by borehole geophones, Geophysical Journal International, Volume 228, Issue 3, March 2022, Pages 2018–2037, https://doi.org/10.1093/gji/ggab458
-

Seismic data from volcano observatories and from laboratory experiments, plus description of novel methods of data analysis and synchronization. 6 papers - Library for volcanology and rock physics data analysis; An innovative platform to allow collaborative research in rock physics and volcanology; Trends in the aggregated rate of pre-eruptive seismicity at Kilauea volcano, Hawaii; Convergence of the frequency-size distribution of global earthquakes; Method for predictability of volcanic eruptions from monitored seismic data and; Evaluation of the failure forecasting model for volcanic eruptions.
-
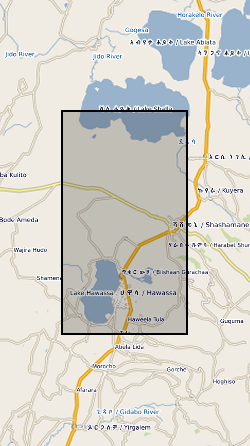
This dataset contains the locations and other pertinent information for 122 well-constrained seismic events that occurred on or near Corbetti between February 2016 and September 2017. These locations were derived from data collected on 37 broadband seismometers deployed as part of the RiftVolc project. The data were originally published in Lavayssière, A., et al. "Local seismicity near the actively deforming Corbetti volcano in the Main Ethiopian Rift." Journal of Volcanology and Geothermal Research (2019). https://doi.org/10.1016/j.jvolgeores.2019.06.008
-

Data deposited are connected to paper "Investigating the use of 3-D full-waveform inversion to characterize the host rock at a geological disposal site" by H.L.M. Bentham, J.V. Morgan and D.A. Angus, in Geophysical Journal International, https://doi.org/10.1093/gji/ggy386. The geological model consists of fractured granite host rock (depth: 800 - 1200 m) with an Excavated disturbed Zone (EdZ) that could be formed through constructing the tunnels. In addition to the host rock, the model contains sedimentary overburden (depth: 0 - 800 m) and a fractured granite bed rock (depth: 1200 - 2000 m). Seismic velocities and rock properties were assigned through analogues e.g. Olkiluoto, Finland. Full data description and method found in Bentham et al. (2018). Data deposited are for Case 1 (no tunnels) and Case 3 (with multiple tunnels). For each case, the following 3D volumes are available: * Seismic data * True velocity model (used to generate seismic data) * Starting velocity model for full-waveform inversion Additionally, the following ASCII files are available to aid the use of the seismic and velocity models: * Locations of sources at surface (Case 1, 2 and 3 except where survey area is reduced [see GJI article]) * Locations of receivers at surface and below tunnels (Case 1, 2 and 3) * Locations of receiver at surface and above and below tunnels (Case 3 only)
-

A new, robust seismic hazard model and seismic hazard maps for the UK offshore Exclusive Economic Zone using the latest available data and recent advances in seismic hazard methodology and a Monte Carlo-based approach for probabilistic seismic hazard analysis. These are intended to update the current maps for UK waters published in 2002. We developed a comprehensive catalogue of earthquake activity across the region by combining existing earthquake catalogues and data from regional and local monitoring agencies. We modelled earthquake occurrence across the region using a seismic source characterisation (SSC) model that consists of a series of zones, where seismicity is considered to be homogeneous, based on tectonics, geology and seismicity of the study area. We use four different seismic source zone models within the SSC to capture the epistemic uncertainty in different rupture scenarios. A logic tree approach was used to account for the epistemic uncertainty in earthquake activity rates, maximum magnitude, earthquake depth distribution, and faulting style. Ground motions are estimated for different rupture scenarios using a ground motion characterisation (GMC) model that consists of five multiple ground motion prediction equations considered to be applicable to the region. The GMPEs are included in a logic tree where the weights are informed by the fit between observed and modelled ground motions. The GMC model also includes the host-to-target adjustments and a single-station sigma model. Hazard is calculated at 4585 individual points spaced at 0.125° in latitude and 0.25° in longitude for peak ground acceleration (PGA) and spectral acceleration at 0.2 s (SA0.2 s) and 1.0 s (SA1.0 s) for 5% damping and rock conditions and the return periods of 95, 475, 1100, 2475, and 5000 years. This is the first time that maps of the seismic hazard at short (0.2 s) and long periods (1.0 s) have been produced for UK waters. Hazard curves, uniform hazard spectra, and disaggregation analysis have been calculated for three offshore carbon capture and storage sites (Endurance, Acorn, and HyNet North West). New offshore hazard maps for the UK waters will support UK decarbonisation by providing owners and operators of offshore structures with robust estimates of seismic hazard for new and existing sites. The results will also inform regulatory decisions to ensure safe operating practices in the industry and help identify areas of higher hazard where further site-specific studies might be needed. Finally, it will provide a robust baseline for tectonic seismic activity in the North Sea that can be used to help discriminate any seismicity induced by operations, such as CCS, in the event it occurs. The technical report by Mosca et al. (2024), which provides a detailed description of the methods and results, together with the project’s products, can be found in (http://www.earthquakes.bgs.ac.uk/hazard/UKhazard.html).
-
These data contain the shear modulus and attenuation of Vermont antigorite serpentinite in the seismic "low" frequency range, as functions of oscillation period (ranging from 1 to 1000s) and temperature during staged cooling from 550 degrees C down to room temperature, at a confining pressure of 200 MPa. This dataset is used and fully described/interpreted in the paper: David, E.C., N. Brantut, L.N. Hansen and I. Jackson, Low-frequency measurements of seismic velocity and attenuation in antigorite serpentinite, submitted to Geophys. Res. Lett.
-

These data represent a series of analyses exploring the seismic behaviours of low-cohesion volcanic sediments – in this case the Neapolitan Yellow Tuff - under varying strain rates. The data include deformation logs from triaxial compression experiments, and the accompanying 12-channel acoustic emission recordings at 10 MHz. These are paired with X-Ray Computed Tomography images of one of the cores from both before and after deformation, to examine damage behaviour. These data include: Deformation logs captured from the triaxial press Acoustic emission event data Processed acoustic emission sonograms for selected events Matlab code for processing of sonograms Matlab code for statistical analysis of the acoustic emission data Before and after X-Ray Computed tomography data for a core which underwent 2% strain at a rate of 4x10⁻⁶ s-1. These data relate to Rowley et al - Deformation controlled Long-Period seismicity in low cohesion volcanic sediments https://doi.org/10.31223/osf.io/7rkzv