 NERC Data Catalogue Service
Holocene
Type of resources
Topics
Keywords
Contact for the resource
Provided by
Years
Formats
Representation types
Update frequencies
-
Data derived from NERC Grant NE/N001621/1. Geographical Area - DSDP/ODP/IODP Sites 516, 1138, 925, 242, 1338, 871, 872
-
Dataset contains an interannual to sub centennial resolution record of carbonate oxygen and carbon isotopes, bulk sediment geochemistry and sedimentology from a 2.95 metre-long core (YC2) from Yaal Chac. The core was dated using a combination of radiocarbon dates and short-lived radio-isotopes. Data are presented in Metcalfe et al (2022) Quaternary Science Reviews https://doi.org/10.1016/j.quascirev.2022.107445
-

A new family of spherical harmonic geomagnetic field models spanning the past 9000 yr based on magnetic field directions and intensity stored in archaeological artefacts, igneous rocks and sediment records. The pfm9k geomagnetic field models and datafiles as well as the individual bootstraps of the pfm9k.1b geomagnetic field model presented in A. Nilsson, R. Holme, M. Korte, N. Suttie and M. Hill (2014): Reconstructing Holocene geomagnetic field variation: new methods, models and implications. Geophys. J. Int., doi: 10.1093/gji/ggu120 are included here.
-
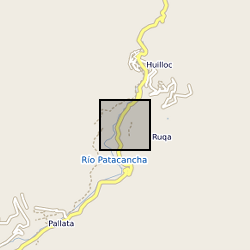
Concentration and accumulation palaeoenvironmental proxy data derived from a 6.3m sedimentary core drilled at Marcacocha, a present-day wetland (formerly a small lake) located at 3355m above sea-level in the Cordillera Oriental of the Peruvian Andes. Multi-proxy analysis of the sediments at decadal to sub-decadal temporal resolution has provided detailed datasets that include sedimentology, palynology, geochemistry, plant macrofossils, diatoms and oribatid mite remains (Chepstow-Lusty et al., 2003, 2007, 2009; Sterken et al., 2006). Select data are presented here relating to the uppermost 1.9m of the sequence (ca. the last 1200 years). The data relate specifically to: Chepstow-Lusty, A., Frogley, M.R., Baker, A.S. Comparison of Sporormiella dung fungal spores and oribatid mites as indicators of large herbivore presence: evidence from the Cuzco region of Peru. J. Arch. Sci. https://doi.org/10.1016/j.jas.2018.12.006 Chepstow-Lusty, A., Bennett, K., Fjeldså, J., Kendall, A., Galiano, W., Tupayachi Herrera, A., 1998. Tracing 4000 years of environmental history in the Cuzco area, Peru, from the pollen record. Mt. Res. Dev. 18, 159–172. Chepstow-Lusty, A., Frogley, M.R., Bauer, B.S., Bush, M.B., Tupayachi Herrera, A., 2003. A late Holocene record of arid events from the Cuzco region, Peru. J. Quat. Sci. 18, 491–502. Chepstow-Lusty, A., Frogley, M.R., Bauer, B.S., Leng, M., Cundy, A., Boessenkool, K.P., Gioda, A., 2007. Evaluating socio-economic change in the Andes using oribatid mite abundances as indicators of domestic animal densities. J. Arch. Sci. 34, 1178–1186. Chepstow-Lusty, A.J., Frogley, M.R., Bauer, B., Leng, M.J., Boessenkool, K.P., Carcaillet, C., Ali, A.A., Gioda, A., 2009. Putting the rise of the Inca empire within a climatic and land management context. Clim. Past 5, 1–14. Sterken, M., Sabbe, K., Chepstow-Lusty, A., Frogley, M., Vanhoutte, K., Verleyen, E., Cundy, A., Vyverman, W., 2006. Climate and land-use changes in the Cuzco region (Cordillera Oriental, South East Peru) during the last 1200 years: a diatom based reconstruction. Arch. Hydrobiol. 165, 289–312.
-
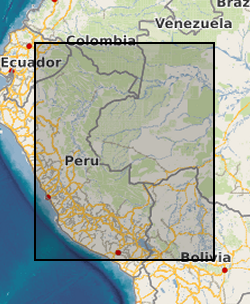
The dataset is the output of a NERC fellowship aimed to understand the long-term dynamics of tropical vegetation through palaeoecological analysis. For doing this, two sedimentary archives (Laguna Pindo and Laguna Baños) from Ecuador were radiocarbon dated and analysed for pollen, non-pollen palynomorphs, charcoal, chironomids, stable isotopes and XRF of tephra deposits. Each proxy was analysed at different resolution. Laguna Pindo is a mid-elevation lake (1250 m asl) that spans the last 50,000 years. Laguna Baños is an Andean lake located at 3800 m asl and contains sediments representative of the last 6500 years. Both water bodies are very shallow. The data is presented mainly in excel spreadsheets as raw data (except for radiocarbon dating data, which are the PDF files provided by NRCF), without any math treatment or conversion. Publication associated with NERC grant, Frazer Matthews-Bird, Stephen J. Brooks, Philip B. Holden, Encarni Montoya, and William D. Gosling (2016), Inferring late-Holocene climate in the Ecuadorian Andes using a chironomid-based temperature inference model. Clim. Past, 12, 1263-1280, 2016. doi:10.5194/cp-12-1263-2016
-
Data for Figure SPM.1 from the Summary for Policymakers (SPM) of the Working Group I (WGI) Contribution to the Intergovernmental Panel on Climate Change (IPCC) Sixth Assessment Report (AR6). Figure SPM.1 shows global temperature history and causes of recent warming. --------------------------------------------------- How to cite this dataset --------------------------------------------------- When citing this dataset, please include both the data citation below (under 'Citable as') and the following citation for the report component from which the figure originates: IPCC, 2021: Summary for Policymakers. In: Climate Change 2021: The Physical Science Basis. Contribution of Working Group I to the Sixth Assessment Report of the Intergovernmental Panel on Climate Change [Masson-Delmotte, V., P. Zhai, A. Pirani, S. L. Connors, C. Péan, S. Berger, N. Caud, Y. Chen, L. Goldfarb, M. I. Gomis, M. Huang, K. Leitzell, E. Lonnoy, J.B.R. Matthews, T. K. Maycock, T. Waterfield, O. Yelekçi, R. Yu and B. Zhou (eds.)]. Cambridge University Press. In Press. --------------------------------------------------- Figure subpanels --------------------------------------------------- The figure has two panels, with data provided for all panels in subdirectories named panel_a and panel_b. --------------------------------------------------- List of data provided --------------------------------------------------- Panel a The dataset contains: - Estimated temperature during the warmest multi-century period in at least the last 100,000 years, which occurred around 6500 years ago (4500 BCE), multi-centennial average, from AR6 WGI Chapter 2 - Global surface temperature change time series relative to 1850-1900 for 1-2020 from: • 1-2000 CE reconstruction from paleoclimate archives, decadal smoothed, from PAGES2k Consortium (2019, DOI: 10.1038/s41561-019-0400-0) • 1850-2020 CE, observations, decadal smoothed, from AR6 WGI Chapter 2 assessed mean Panel b: The dataset contains global surface temperature change time series relative to 1850-1900 for 1850-2020 from simulations from the sixth phase of the Coupled Model Intercomparison Project (CMIP6) and observations: - CMIP6 historical+ssp245 simulations (simulations with human and natural forcing, 1850-2019) - CMIP6 hist-nat simulations (simulations with natural forcing, 1850-2019) - Global Surface Temperature Anomalies (GSTA) relative to 1850-1900 from observations assessed in IPCC AR6 WG1 Chapter 2 (1850-2020) --------------------------------------------------- Data provided in relation to figure --------------------------------------------------- Panel a: - panel_a/SPM1_1-2000_recon.txt, 1-2000 time series, decadal smoothed, for years centered on 5-1996 CE [column 1 grey line, columns 2 and 3 grey shading] - panel_a/SPM1_1850-2020_obs.txt, 1850-2020 time series, decadal smoothed, for years centered on 1855-2016 CE [black line] - panel_a/SPM1_6500_recon.txt, bar for the warmest multi-century period in more than 100,000 years (around 6500 years ago: 4500 BCE) [grey bar] Panel b: - panel_b/gmst_changes_model_and_obs.csv. Global surface temperature change time series relative to 1850-1900 for 1850-2020 from: • CMIP6 historical+ssp245 simulations (1850-2019) [mean, brown line] • CMIP6 historical+ssp245 simulations (1850-2019) [5% range, brown shading, bottom] • CMIP6 historical+ssp245 simulations (1850-2019) [95% range, brown shading, top] • CMIP6 hist-nat simulations (1850-2019) [mean, green line] • CMIP6 hist-nat simulations (1850-2019) [5% range, green shading, bottom] • CMIP6 hist-nat simulations (1850-2019) [95% range, green shading, top] • Global Surface Temperature Anomalies (GSTA) relative to 1850-1900 from observations assessed in IPCC AR6 WG1 Chapter 2 (1850-2020) [black line] --------------------------------------------------- Sources of additional information --------------------------------------------------- The following weblinks are provided in the Related Documents section of this catalogue record: - Link to the report webpage, which includes the report component containing the figure (Summary for Policymakers), the Technical Summary (Cross-Section Box TS.1, Figure 1a) and the Supplementary Material for Chapters 2 and 3, which contains details on the input data used in Tables 2.SM.1 (Figure 2.11a) and 3.SM.1 (Figure 3.2c; FAQ 3.1, Figure 1). - Link to related publication for input data
-
Geochemical data for the upper 300cm of giant piston core MD04-2832. Core MD04-2832 was collected from the middle basin of Loch Sunart a fjord on the west coast of Scotland from the research vessel Marion Dufresne on the 15th of June 2004. This data resource includes five data sheets: (1) Geochemical data, (2) Bulk radiocarbon, (3) ICP-MS, (4) FRUITS and (5) Age Model. 1. Geochemical data sheet includes Bulk elemental data (Organic Carbon, Nitrogen, C/N ratio, N/C ratio), Isotopic data (δ13C and ẟ15N), Biomarker data (Alkanes, Fatty Acids, GDGT's) and thermosgravimetric data (% labile, recalcitrant and refractory organic matter). 2. Bulk Radiocarbon data sheet includes bulk radiocarbon data for ten sediment samples presented as % modern, 14C Age (years BP), ẟ14C and Δ14C. 3. ICP-MS data sheet includes metal data associated with mining activities within the fjords catchment. Data includes Zinc (Zn), Lead (Pb), Copper (Cu), Barium (Ba), Aluminium (Al) and elemental ratios of these metal normalized with Al concentrations. 4. The FRUITS data sheet contains the outputs from the FRUITS Bayesian isotopic mixing model (Fernandes et al., 2014) used to constrain the source (terrestrial vs marine) of the organic carbon found at site MD04-2832. The model used bulk elemental ratios (N/C), Isotopic (δ13C and ẟ15N) and biomarker data (GDGT - BIT Index) to calculate the terrestrial and marine OC fraction from each downcore sample. 5. The Age Model datasheet contains the age model produced by the BACON software package (Blaauw and Christen, 2011). The age model was developed with a combination of shell/foraminifera radiocarbon dates and radiometric dating (210Pb and 137Cs). Further details on the data can be found in Smeaton, C., Cui, X., Bianchi, T.S., Cage, A.G., Howe J.A., Austin, W.E.N., (2021), The evolution of a coastal carbon store over the last millennium, Quaternary Science Reviews.