Geological mapping
Type of resources
Available actions
Topics
Keywords
Contact for the resource
Provided by
Years
Formats
Representation types
Update frequencies
Scale
-
This database comprises field notebooks reporting geological field work associated with NERC Standard Grant NE/R001324/1 from 1/10/2017 – 30/6/2021. The fieldwork involved examination of Ordovician – Devonian sequences from North Wales and Scotland. Samples were collected for palynological analysis. Palynological processing involves the recovery of organic-walled microfossils by hydrochloric and hydrofluoric acid maceration. Details of other non-NERC-funded fieldwork undertaken during this period is included in the field notebooks.
-
Field notebook photos and scans for NERC grant Tellurium and Selenium Cycling and Supply. Various sites in Ireland, Scotland, England, North Wales, Norway, Utah, Colorado and Wyoming.
-
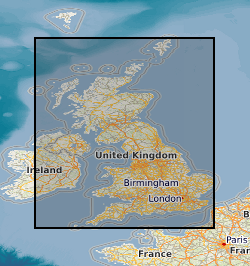
This layer of the GeoIndex shows the location of available 1:25000 scale digital geological maps within Great Britain. The Digital Geological Map of Great Britain project (DiGMapGB) has prepared 1:625 000, 1:250 000 and 1:50 000 scale datasets for England, Wales and Scotland. The datasets themselves are available as vector data in a variety of formats in which they are structured into themes primarily for use in geographical information systems (GIS) where they can be integrated with other types of spatial data for analysis and problem solving in many earth-science-related issues. The DiGMapGB-10 dataset is as yet incomplete, current work is concentrated on extending the geographical cover, especially to cover high priority urban areas.
-

1:1.5M scale 'Geology Through Climate Change' poster map covering UK mainland, Northern Ireland and Eire. This poster map shows the rocks of Britain and Ireland in a new way, grouped and coloured according to the environment under which they were formed. Photographs illustrate modern-day environments, alongside images of the typical rock types which are formed in them. The ages of the rocks are shown in a timeline, which also shows global temperatures and sea levels changing through time. The changing positions of Britain and Ireland as they drifted northwards through geological time are illustrated too. It was jointly produced by the BGS, the Geological Survey of Northern Ireland and the Geological Survey of Ireland. It has been endorsed by a range of teaching organisations including WJEC (previously the Welsh Joint Education Committee), OCR (Oxford Cambridge and RSA Examinations), The Association of Teaching Organisations of Ireland and the Earth Science Teachers Association. Although primarily intended as a teaching resource, the poster map will be of interest to anyone seeking to understand the imprint geological time has left in the rocks of our islands. This poster map is free, all you pay is the postage and packing.
-

These maps are based on the Ordnance Survey 'Old Series' One-Inch maps of England and Wales. They were the first 1:63 360 geological map series produced by the Geological Survey in England and Wales. Sheets were initially published as full sheets, and later as quarter sheets (NW, NE, SW, SE). Earlier maps are hand-coloured, later maps are colour-printed. The maps show both solid and drift geology. The OS 'Old Series' maps extended as far north as a line drawn between Preston and the Humber. To the north of this, the maps use the same sheetlines as the 1:63 360 New Series, and carry two sheet numbers, which refer to the Old Series (91-110) and New Series (1-73) numbering. These maps are common to both series. A sheet that covers the Isle of Man is also included in the series. Geological maps represent a geologist's compiled interpretation of the geology of an area. A geologist will consider the data available at the time, including measurements and observations collected during field campaigns, as well as their knowledge of geological processes and the geological context to create a model of the geology of an area. This model is then fitted to a topographic basemap and drawn up at the appropriate scale, with generalization if necessary, to create a geological map, which is a representation of the geological model. Explanatory notes and vertical and horizontal cross sections may be published with the map. Geological maps may be created to show various aspects of the geology, or themes. These maps are hard-copy paper records stored in the National Geoscience Data Centre (NGDC) and are delivered as digital scans through the BGS website.
-
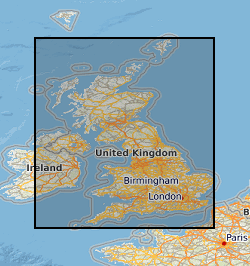
This dataset contains scans of Applied Geology Maps (AGMs) and sections, which are also known as thematic maps, Environmental Geology Maps (EGMs) or Planning for Development Maps (PfD). They were produced as part of 'Geological Background for Planning and Development' and preliminary sand and gravel projects carried out by the British Geological Survey for the Department of the Environment, Transport and the Regions (DETR), the Scottish Development Department and Scottish Office from 1975 to 1996. The maps and sections cover a number of themes (up to 22) for specific areas relating to the project area within the United Kingdom (which are mostly urban areas). Themes include simplified bedrock and superficial maps, drift thickness, drift lithology, rockhead contours and a range of mining-related themes. Each area had its own custom set of maps and were issued with an accompanying BGS Technical Report. The maps and report were sometimes issued as a pack, but for some areas they were made available separately. The geological linework and the methods used to produce the maps are those current at the time of production. Map scales are predominantly 1:10 000 or 1:25 000, with a few 1:50 000 maps. The maps have Ordnance Survey map bases and are bounded by the project area. The maps could be used for geological, engineering geological, environmental and resources research, as an information and reference resource and for inclusion in reports and papers. These maps are hard-copy paper records and digital scans, stored in the National Geoscience Data Centre (NGDC).
-

The UTM series of maps are based on 1:250 000 base maps published by the Ordnance Survey. Mapping is divided into squares which cover 1 degree by 1 degree of latitude / longitude in the Universal Transverse Mercator (UTM) projection, and coverage extends offshore and onto the continental shelf. The UTM series are available in three different themes: - Solid geology (complete coverage within the mapped area, including most of the UK continental shelf) - Sea bed sediments (coverage for most offshore areas) - Quaternary geology (coverage for the UK sector of the North Sea, Irish Sea and the Atlantic margin) Also included within this series are two small-scale (1:500 000) bedrock geology maps of the Central Rockall Basin and North Rockall Basin. These maps supersede the older quarter-inch series of maps which were published for England / Wales and Scotland. Geological maps represent a geologist's compiled interpretation of the geology of an area. A geologist will consider the data available at the time, including measurements and observations collected during field campaigns, as well as their knowledge of geological processes and the geological context to create a model of the geology of an area. This model is then fitted to a topographic basemap and drawn up at the appropriate scale, with generalization if necessary, to create a geological map, which is a representation of the geological model. Explanatory notes and vertical and horizontal cross sections may be published with the map. These maps are, for the most part, hard-copy paper records stored in the National Geoscience Data Centre (NGDC) and are delivered as digital scans through the BGS website.
-

A series of maps at the detailed scale of 1:25 000 have been produced for areas of outstanding geological interest in Great Britain. Some maps are accompanied by explanatory booklets. The maps were published between 1954 and 2007. About 60 maps have been published, some showing solid geology, some drift geology and some combined solid and drift. Most of the maps include geological cross sections and generalised vertical sections. Geological maps represent a geologist's compiled interpretation of the geology of an area. A geologist will consider the data available at the time, including measurements and observations collected during field campaigns, as well as their knowledge of geological processes and the geological context to create a model of the geology of an area. This model is then fitted to a topographic basemap and drawn up at the appropriate scale, with generalization if necessary, to create a geological map, which is a representation of the geological model. Explanatory notes and vertical and horizontal cross sections may be published with the map. Geological maps may be created to show various aspects of the geology, or themes. These maps are hard-copy paper records stored in the National Geoscience Data Centre (NGDC) and are delivered as digital scans through the BGS website.
-
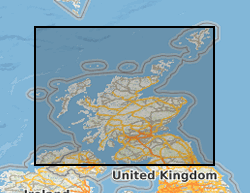
[This metadata record has been superseded, see http://data.bgs.ac.uk/id/dataHolding/13606458] Scanned copies of Scottish 1 inch scale maps which are annotated with fossil locations and geology. Printed topography with hand annotated fossil locations and geology with cross sections and colour-wash with index and observations. Considered working material towards published geological maps.
-

For much of the Geological Survey's existence, the County Series of maps were the standard large-scale maps on which geological mapping was undertaken. These maps are based on the Ordnance Survey County (or six-inch to the mile) series of maps. These maps were cut up to be used in the field to record geological observations, and on return to the office, the geology was transferred to a complete County Series map, which after approval was known as a 'standard' (England / Wales) or 'clean copy' (Scotland). This dataset contains the 'standard' or 'clean copy' County Series maps held by BGS. Geological maps represent a geologist's compiled interpretation of the geology of an area. A geologist will consider the data available at the time, including measurements and observations collected during field campaigns, as well as their knowledge of geological processes and the geological context to create a model of the geology of an area. This model is then fitted to a topographic basemap and drawn up at the appropriate scale, with generalization if necessary, to create a geological map, which is a representation of the geological model. Explanatory notes and vertical and horizontal cross sections may be published with the map. Geological maps may be created to show various aspects of the geology, or themes. The most common map themes held by BGS are solid (later referred to as bedrock) and drift (later referred to as superficial). These maps are hard-copy paper records stored in the National Geoscience Data Centre (NGDC) and are delivered as digital scans through the BGS website.
 NERC Data Catalogue Service