 NERC Data Catalogue Service
Faulting
Type of resources
Topics
Keywords
Contact for the resource
Provided by
Years
Formats
Representation types
Update frequencies
-

This dataset is a catalogue of elastic stress models of hydraulic fracturing during the 2018 Preston New Road, PNR-1z operations (described in Clarke et al., 2019). This modelling was produced for the publication Kettlety et al. (2020), which studies the physical mechanisms controlling seismicity during hydraulic fracturing. For further details on the modelling approach and context for these data, see Kettlety et al. (2020) and the README file attached here.
-
This collection comprises two time-series of 3D in-situ synchrotron x-ray microtomography (μCT) volumes showing two Ailsa Craig micro-granite samples (ACfresh02 and ACHT01) undergoing triaxial deformation. These data were collected in-situ at the PSICHE beamline at the SOLEIL synchrotron, Gif-sur-Yvette, France in December 2016 (standard proposal 20160434) and are fully explained in Cartwright-Taylor A., Main, I.G., Butler, I.B., Fusseis, F., Flynn M. and King, A. (in press), Catastrophic failure: how and when? Insights from 4D in-situ x-ray micro-tomography, J. Geophys. Res. Solid Earth. Together, these two time-series show the influence of heterogeneity on the micro-crack network evolution. Ailsa Craig micro-granite is known for being virtually crack-free. One sample (ACfresh02) remained as-received from the quarry until it was deformed, while the second (ACHT01) was slowly heated to 600 degC and then slowly cooled prior to deformation in order to introduce material disorder in the form of a network of nano-scale thermal cracks. Thus these two samples represent two extreme end-members: (i) ACfresh02 with the lowest possible (to our knowledge) natural pre-existing crack density, and so is a relatively homogeneous sample and (ii) ACHT01 with a thermally-induced nano-crack network imprinted over the nominally crack-free microstructure, and therefore has increased heterogeneity relative to ACfresh02. Each 3D μCT volume shows the sub-region of each sample in which the majority of damage was located and has three parts. Part one is reconstructed 16-bit greyscale data. Part two is 8-bit binary data showing individual voids (pores and micro-cracks) in the dataset after segmentation. Part three is 32-bit data showing the local thickness of each void, as in Cartwright-Taylor et al. (in press) Figures 4 and 5. Each part is a zip file containing a sequence of 2D image files (.tif), sequentially numbered according to the depth (in pixels, parallel to the loading axis) at which it lies within the sample volume. File dimensions are in pixels (2D), with an edge length of 2.7 microns. Each zip file is labelled with the sample name, the relevant letter for each 3D volume as given in Cartwright-Taylor et al. (in press) Tables 3 and 4, part 1, 2 or 3 (depending whether the data are greyscale, binary or local thickness respectively), the differential stress (MPa) on the sample, and the associated ram pressure (bar) to link with individual file names. The following convention is used: sample_letter_part_differentialstress_rampressure_datatype. Also included are (i) two spreadsheets (.xlsx), one for each sample, containing processing parameters and the mechanical stress and strain at which each volume was scanned, and (ii) zip files containing .csv files containing measurement data for the labelled voids in each volume. N.B. void label numbers are not consistent between volumes so they can only be used to obtain global statistics, not to track individual voids.
-
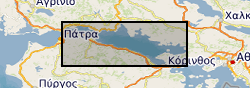
The data are derived from interpretation of seismic reflection profiles within the offshore Corinth Rift, Greece (the Gulf of Corinth) integrated with IODP scientific ocean drilling borehole data from IODP Expedition 381 (McNeill et al., 2019a, 2019b). The data include rift fault coordinate (location, geometry) information and slip rate and extension rate information for the major faults. Seismic reflection data were published in Taylor et al. (2011) and in Nixon et al. (2016). Preliminary fault interpretations and rate data, prior to IODP drilling, were published in Nixon et al. (2016). Details of datasets: The data can be viewed in GIS software (ArcGIS, QGIS) or the Excel and .dbf files can be used for viewing of rate data and import of fault coordinates into other software. The 4 folders are for different time periods with shape files for the N-Dipping and S-Dipping Faults in the offshore Corinth Rift and respective slip and extension (horizontal) rates. The shapefiles are digitised fault traces for the basement offsetting faults, picked from the Multichannel Seismic Data collected by the R/V Maurice Ewing. Fault traces are segmented and each segment has an average throw (vertical) rate (Tavg) in mm/yr. The rates for the segments are averages based on measurements at the ends of each segment. The major fault trace segments also have slip-rates (slip_rate) and extension-rates (ext_rate or extension_) in mm/yr. All rates as well as the names for major faults can be located in the attribute table of the shape files along with X- and Y-coordinates. The coordinate system is WGS84 UTM Zone 34N. The shape files can be loaded into a GIS (ArcGIS, QGIS etc.) allowing mapping and visualization of the fault traces and their activity rates. In addition, the attribute tables are .dbf files found within each folder. These have also been provided as .xlsx (Excel) files which include the fault coordinate information, and slip rates and extension rates along the major faults. References McNeill, L.C., Shillington, D.J., Carter, G.D.O., and the Expedition 381 Participants, 2019a. Corinth Active Rift Development. Proceedings of the International Ocean Discovery Program, 381: College Station, TX (International Ocean Discovery Program). McNeill, L.C., Shillington, D.J., et al., 2019b, High-resolution record reveals climate-driven environmental and sedimentary changes in an active rift, Scientific Reports, 9, 3116. Nixon, C.W., McNeill, L.C., Bull, J.M., Bell, R.E., Gawthorpe, R.L., Henstock, T.J., Christodoulou, D., Ford, M., Taylor, B., Sakellariou, S. et al., 2016. Rapid spatiotemporal variations in rift structure during development of the Corinth Rift, central Greece. Tectonics, 35, 1225–1248. Taylor, B., J. R. Weiss, A. M. Goodliffe, M. Sachpazi, M. Laigle, and A. Hirn (2011), The structures, stratigraphy and evolution of the Gulf of Corinth Rift, Greece, Geophys. J. Int., 185(3), 1189–1219.