 NERC Data Catalogue Service
jpg
Type of resources
Topics
Keywords
Contact for the resource
Provided by
Years
Formats
Representation types
Update frequencies
Resolution
-

This image dataset was captured as part of the operation of an automated weather station at the Virkisjökull-Falljökull Glacier, SE Iceland. The station formed part of the BGS Iceland Glacier Observatory network of sensors, deployed between 2009 and 2020 in order to characterise and identify glacial, geomorphological and hydrological drivers and processes and their timescales across the deglaciating Virkisjökull-Falljökull catchment in SE Iceland. This image time series was generated alongside the continuous operation of two further weather stations, river gauging, a network of groundwater level gauges and numerous other forms of monitoring. The records presented here begin in September 2011 with the installation of the camera on the weather station, and continue to December 2019. The data complements the published groundwater and river gauging datasets published here, and will be of use to researchers, teachers and students wishing to see an excellent example of glacier flow, or those interested in the processes observed in a rapidly deglaciating landscape, including anyone interested to follow up on the various research studies published from this site in the international literature. The BGS project was led and coordinated by Dr Jez Everest, and during earlier years Tom Bradwell (Uni of Stirling, formerly BGS). Technical support and implementation was provided by Heiko Buxel and Tom Shanahan. The dataset is not fully continuous as certain periods were lost due to equipment downtime. Enquiries are welcome and should be directed to Dr Everest.
-

This image dataset was captured as part of the operation of an automated weather station at the Virkisjökull-Falljökull Glacier, SE Iceland. The station formed part of the BGS Iceland Glacier Observatory network of sensors, deployed between 2009 and 2020 in order to characterise and identify glacial, geomorphological and hydrological drivers and processes and their timescales across the deglaciating Virkisjökull-Falljökull catchment in SE Iceland. This image time series was captured at (WGS-84) 63°58’12.78?N 16°47’5.64?W, on a lateral moraine sequence adjacent to the glacier icefall and were generated alongside the continuous operation of two further weather stations, river gauging, a network of groundwater level gauges and numerous other forms of monitoring. The records presented here begin in September 2011 with the installation of the camera on the weather station, and continue to February 2018. The data complements the published groundwater and river gauging datasets published here, and will be of use to researchers, teachers and students wishing to see an excellent example of glacier flow, or those interested in the processes observed in a rapidly deglaciating landscape, including anyone interested to follow up on the various research studies published from this site in the international literature. The BGS project was led and coordinated by Dr Jez Everest, and during earlier years Tom Bradwell (Uni of Stirling, formerly BGS). Technical support and implementation was provided by Heiko Buxel and Tom Shanahan. The dataset is not fully continuous as certain periods were lost due to equipment downtime. Enquiries are welcome and should be directed to Dr Everest.
-

This image dataset was captured as part of the operation of a river gauging station on the Virkisá River, SE Iceland. The station formed part of the BGS Iceland Glacier Observatory network of sensors, deployed between 2009 and 2020 in order to characterise and identify glacial, geomorphological and hydrological drivers and processes and their timescales across the deglaciating Virkisjökull-Falljökull catchment in SE Iceland. The records presented here begin in September 2011 with the installation of the river gauging station, and continue to August 2020. Responsibility for the station passed to the Icelandic Meteorological Office in January 2018. The gauge is understood to remain operational as at August 2024. The data complements the published meteorological and river gauging datasets published here, and will be of use to researchers and students interested in the hydrology of a rapidly deglaciating landscape, including anyone interested to follow up on the various research studies published from this site in the international literature.
-
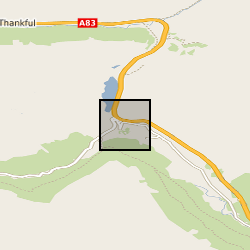
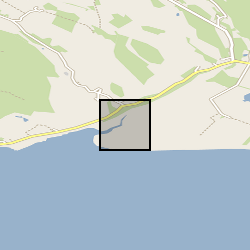
Fixed time lapse camera imagery with 15 minute interval during daytimes captured from Ben Donich (BNG: NN 2297 0637) looking towards the A83 Rest and Be Thankful / slope of Beinn Luibhean. Data were subsequently processed in https://doi.org/10.3390/rs13050893 for deformation tracking. There are data gaps during poor weather/outages, and, some camera shift requiring alignment.
-
Measurements of the aspect ratio of plagioclase grains in dolerites from sills. Photomicrographs (several per sample across each of the sills, at a magnification such that the long side of the field of view is 4.5mm long) are each accompanied by a drawing showing a pair of lines for each observable grain, giving the long and short axis of the grain intersection as viewed in thin section, together with a drawing showing only the long axes of each grain. A summary file provides the number of grains measured in each sample, together with the average aspect ratio, with 1σ uncertainties calculated using a bootstrap method. The grain size is reported for all grains measurable in the set of photomicrographs (in mm), and is taken as the length of the long axis for each grain intersection in thin section. The average grain size and the skew of the population is also provided. The choice of the area in each thin section to photograph and analyse was random, although any areas of late-stage alteration were avoided. This dataset is useful to anyone seeking to quantify plagioclase grain size in tabular mafic intrusions.
-
The dataset contains raw hemispherical photographs of canopy structure representative for 0.5 ha permanent plots (26) across Caatinga area in Brazil. The photographs were taken between March 2017 and August 2019, using a digital camera (NIKON D100) with a Sigma 4.5 mm F2.8 fisheye lens. When processed the photos provide a representative value of LAI (Leaf area index) for the plot. Full details about this dataset can be found at https://doi.org/10.5285/a1c0f869-6e03-4902-af94-31e90ba141a0
-
This dataset contains photographs of pairs of Streptomyces bacteria and it was collected with the aim of interrogating the manner and means of the interactions. The four imaged Streptomyces were originally isolated from a nature reserve in Minnesota, USA. Images show the interaction phenotypes between each pairing (including self to self), with images taken daily on International Streptomyces Project-2 (ISP-2) agar. This work was funded by NERC (NE/T010959/1) and National Science Foundation (USA, 1935458). Full details about this nonGeographicDataset can be found at https://doi.org/10.5285/3f48eb4c-bc0d-49e3-af71-dcff6d88c534
-

Microscopy (Scanning Electron Microscopy, Cathodoluminescence Imaging) and U-Pb isotopic (Secondary Ionisation Mass Spectrometry) analyses of phosphate minerals in a suite of nine L chondrite meteorites (and one reference analysis of an LL chondrite). The dataset includes multiple SIMS spot analyses of phosphates in each meteorite, as well as images at multiple scales of all grains analysed. The data is reported and analysed in Walton et al., 2022 GCA.
-
This dataset contains river surface velocity data from video footage and from a kinematic current meter, during five surveys on the River Tweed in Scotland from July 2024 to June 2025. For the video footage, different Ground Control Point (GCP) positions and camera angles are adopted for a comparison of error from various image velocimetry techniques. The footage was captured using a nadir angle with a Unmanned Aerial System (UAS), as well as from an oblique view using an iPhone 14 Pro Max camera, with GCPs positioned at the free water surface and at an elevation above the free water surface. The footage frames were extracted and processed using three different image velocimetry softwares (Particle Tracking Velocimetry (PTV), Particle Image Velocimetry (PIV) and Space-Time Image Velocimetry (STIV)). Raw surface velocity outputs from the softwares are recorded herein. The data also includes the extracted frames from the geometrically corrected image velocimetry frames (orthophotos) from the three different viewing angles, and values for tracer density from a preliminary analysis is also included. Discharge data was collated during the final survey in June 2025 using the velocity-area method and salt dilution gauging. This data is recorded alongside an estimation of discharge from image velocimetry surface velocity data using the trapezoidal area of the river. The data was collated for the purpose of evaluating error propagation in image velocimetry applications under operational and sub-optimal environmental conditions. It was collected as part of a PhD project developed to assess the operational efficacy of image velocimetry applications in the UK. The data is complete and unfiltered. Full details about this dataset can be found at https://doi.org/10.5285/c5563ca5-60b9-475b-a4a4-c2d6209674ea
-
Data collected as part of the NERC funded Radioactivity and the Environment (RATE), Long-lived Radionuclides in the Surface Environment (Lo-RISE), research consortium.This data comes from the terrestrial workstream group based at the University of Manchester. The data consists of radionuclide measurements of environmental and biological samples including uranium (238), thorium (232) and radium (226), and soil subsurface and surface biota bioprospecting (plants and AM fungi). The data from this first dataset has been published in the following publication: Davies et al. (2018) Multiple environmental factors influence 238U, 232Th and 226Ra bioaccumulation in arbuscular mycorrhizal-associated plants. Science of the Total Environment 640-641:921-934.