 NERC Data Catalogue Service
XYZ
Type of resources
Available actions
Topics
Keywords
Contact for the resource
Provided by
Years
Formats
Representation types
Update frequencies
-
Wind and surface morphological data collected at Medano Creek on the 15th April 2019 to investigate protodune initiation. Surface morphological data: This is terrestrial laser scanned (TLS) data collected of the creek sand surface using three different co-located Leica TLS (C10, P20 and P50). The data is raw point cloud format in text columns of x, y and z coordinate data. It has been orientation into the same local coordinate system. Each data set uses the same coordinate system. Data can be viewed in any spatial software. Data is labelled using C10, P20 or P50, followed by the scan number. Scan times are indicated in a seperate file. Wind data were collected from a fixed point next to the TLS instruments using a Gill 3D sonic anemometer. The data is in csv file format with column titles and can be viewed in any text or database software.
-

Wind, sediment transport and surface morphological data collected at Sand Creek during a month long field campaign in March and April 2019 to investigate protodune development under bimodal winds. Data is used in the accepted paper ‘Dune initiation in a bimodal wind regime’, Journal of Geophysical Research: Earth Surface, by Delorme, P., Wiggs, G.F.S., Baddock, M.C., Claudin, P., Nield, J.M. and Valdez, A. (accepted 18th September 2020, article reference number 2020JF005757R; https://repository.lboro.ac.uk/articles/Dune_initiation_in_a_bimodal_wind_regime/12973817) Surface morphological data: This is terrestrial laser scanned (TLS) data collected of the creek sand surface during multiple visits. The data is raw point cloud format in text columns of x, y and z coordinate data. It has been orientation in local format (the origin is located at 13UTM 443152, 4184478). *_full_lowres cover the whole creek surface and the banks on either side. * is the date that the data was collected in yymmdd format. All other data is high resolution section of the actual creek surface within the channel. Each data set uses the same coordinate system. Data can be viewed in any spatial software. Wind and sediment data were collected from a fixed point on the eastern edge of the creek channel. The data is in csv file format with column titles and can be viewed in any text or database software. See Delorme et al. (accepted) for more details.
-
Wind, sediment transport and surface/saltation data collected at Huab River Valley during a field campaign in September 2019 to investigate saltation on gravel and sand surfaces. Surface/saltation data: This is terrestrial laser scanned (TLS) data collected over sand and gravel surfaces during multiple days when saltation was active, on a surface approximately 8 m from the TLS, perpendicular to the wind direction. The data is raw point cloud format in text columns of x, y and z coordinate data. Files are named *_^_scan& where * is the date that the data was collected in yymmdd format, ^ is surface type (sand or gravel) and & is the scan number. Each data set uses the same coordinate system. Data can be viewed in any spatial software. Wind and sediment data were collected from a fixed point on each surface, directly downwind of the TLS data. The data is in csv file format with column titles and can be viewed in any text or database software. Data include hot wire measurements at different heights, Wenglor counts, sensit counts and 3D sonic measurements on some days. Sonic data is at 10 Hz, hotwire data at 10 second intervals, transport data is given within both datasets.
-

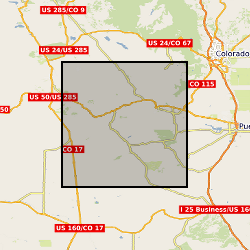
This dataset includes raw point cloud data from repeat terrestrial laser scans (TLS) for measuring ripple and saltation dynamics as well as early-stage protodunes migrating and eroding on a moist surface in the Medano Creek Area, Great Sand Dunes National Park and Preserve, Colorado, USA. As well as the TLS data, additional measurements include wind speed with a CSAT 3D sonic anemometer and sediment transport using a Sensit and Wenglor fork sensors.
-

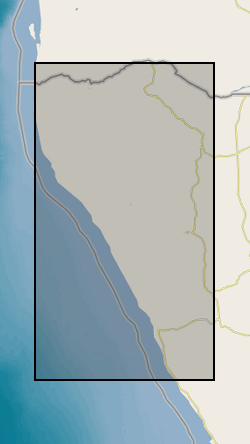
This dataset includes raw point cloud data from repeat terrestrial laser scans (TLS) for measuring early-stage protodunes developing, migrating and eroding on a gravel surface in the Helga's Interdune Area (north), Gobabeb, Namib Desert, Namibia. As well as the TLS data, additional measurements include wind speed with a CSAT 3D sonic anemometer and sediment transport using a Sensit sensor.
-

This dataset includes raw point cloud data from repeat terrestrial laser scans (TLS) for measuring saltation and moisture dynamics as well as early-stage protodunes developing on a moist beach surface. As well as the TLS data, additional measurements include wind speed with a CSAT 3D sonic anemometer and sediment transport using a Sensit and Wenglor fork sensors. Sediment traps were also used for sediment transport, and grain size of the trapped sand was measured.
-

This dataset includes raw point cloud data from repeat terrestrial laser scans (TLS) for measuring early-stage protodunes developing, migrating and eroding on a moist surface in the Medano Creek Area, Great Sand Dunes National Park and Preserve, Colorado, USA. As well as the TLS data, additional measurements include wind speed with a CSAT 3D sonic anemometer and sediment transport using a Sensit and Wenglor fork sensors.
-

This dataset includes raw point cloud and gridded data from repeat terrestrial laser scans (TLS) for measuring barchans and protodunes in the Huab Dune Field, Huab River Valley, Skeleton Coast, Namibia. As well as the TLS data, additional measurements include wind speed, wind direction and sediment transport for some of the measurement period.
-

Time series of long-period magnetotelluric data collected between October 2023 and March 2024 at 9 sites in Scotland, UK, as part of the NERC projects NE/S007407/1 and NE/V002694/1. The data consist of measurements of the Earth’s natural electric and magnetic field variations in five channels and with a 1-sec sampling rate. There is a text file with the site coordinates, a single PDF file containing all relevant metadata, and individual ASCII files for each site named by the site ID.
-

The data set contains the timeseries of long-period magnetotelluric data collected at 44 sites in Great Britain during the SWIMMR-SAGE project 2021-2023. At each site, five channels were recorded with a 1s sampling rate: The magnetic field components (north-south Bx, east-west By, and the vertical component Bz) were measured using a fluxgate magnetometer manufactured from Lemi, Lviv, Ukraine. The horizontal electric field (north-south Ex, east-west Ey) was recorded using non-polarizable electrodes. The installations were performed by BGS staff following the manufacturers guidelines and best practices. For each site, a folder containing the timeseries data and a pdf containing all relevant metadata are provided. Format: YYYY-MM-DD HH:MM:SS BX BY BZ EX EY Magnetic values in units of nT (10^-9 T). Electric field values are in mV/km. A BGS open report has been published on the NERC Open Research Archive (NORA) describing the motivation, site selection and data collection. It is referenced in the metadata and can be found here: https://nora.nerc.ac.uk/id/eprint/537960/