 NERC Data Catalogue Service
Image (TIFF)
Type of resources
Available actions
Topics
Keywords
Contact for the resource
Provided by
Years
Formats
Representation types
Update frequencies
Service types
Scale
-

These images were acquired using micro computed tomographic imaging of 4 sandstone plugs taken at various depths in the Glasgow UKGEOS borehole GGC01. GG496 (170.07 m), GG497 (168.66 m), GG498 (73.37 m) and GG499 (135.06 m). These samples are further detailed and analysed in the following article: http://dx.doi.org/10.1144/petgeo2020-092.
-
Non-contact Atomic Force Microscopy images (NC-AFM) of surface nanobubbles on the carbonate mineral dolomite. Since surface nanobubbles were first imaged in 2000, they have been of growing interest to research due to their long lived properties, with reported lifetimes as long as several hours. Images of nanobubbles were produced under water, collector and depressant conditions using the air water supersaturation method. These are the first images of surface nanobubbles on dolomite. Surface nanobubbles could play a part in the processing of dolomite via froth flotation. These images lay a foundation for future analysis of the effect of nanobubbles in flotation.
-

Each of this set of 3D X-ray tomography datasets show a particle “bead pack” developed as a magmatic mush analogues but of use to anyone investigating non-spherical systems. The stack of tiff images in each 3D dataset show either cuboid, rod and disc/plate like particles as well as irregular shapes and mixtures of these. The data were used to measure packing geometries, contact areas, and pore volumes, surface areas and connectivity, and perform permeability simulation used to develop advanced porosity-permeability relationships for any bead packing geometry. The data were collected on a Nikon XCT scanner with the exact imaging condition for each scan presented in the txt settings file in each folder (including x-ray energy, flux and resolution information). The data may be of use to those developing advanced finite element, discrete element or flow models in complex packed beds.
-

Backscattered electron image (BSE) images of ocean island basalt samples from four volcanic systems in Iceland (Holuhraun, Skuggafjoll, Laki and Eyjafjallajokull) and two eruption sites on Pico Island in the Azores (samples PI-011 and PI-041). These samples are described in the following manuscript: Neave, David A., Alexander G. Stewart, Margaret E. Hartley, and Olivier Namur. ‘Iron Valence Systematics in Clinopyroxene Crystals from Ocean Island Basalts’. Contributions to Mineralogy and Petrology 179 (2024): 67. https://doi.org/10.1007/s00410-024-02144-x.
-

This dataset comprises the raster scans used as source information for capturing DiGMap 1:50000 scale data. The majority were processed under contract in India. Additions have been made. The images are georeferenced.
-

A continuous four-year record of physicochemical properties of soils deglaciated in the last century due to the retreat of Midtre Lovénbreen (ML) glacier in the vicinity of Ny-Ålesund, Svalbard. Below ground data are accompanied by an over ground three-year (2022-2024) photographic record aimed at capturing snow depth levels during the transition seasons between Arctic summer and winter (NET0105681_SUNSPEARS_Photographic data). This dataset aids our understanding of deglaciated soil evolution in the current rapidly changing Arctic landscape. At four locations (reported in NET0105681_SUNSPEARS_GPS data) along the ML glacier forefield, in October 2020, soil in four different stages of development, depending on time elapsed since deglaciation, was sampled. Samples were processed in the laboratory in order to determine their texture (results reported in NET0105681_SUNSPEARS_Particle Size Analysis data) and X-ray CT scanned in order to determine their internal structure (CT reconstructed images reported in NET0105681_SUNSPEARS_Computed Tomography data). At two of the four sampling locations (SUN1 and SUN2), geophysical monitoring stations were installed, which use an array of sensors to continuously measure soil electrical resistivity in 3D (NET0105681_SUNSPEARS_PRIME 3D ERT data). Raw electrical resistivity data, instrument health data and corresponding reconstructed 3D electrical resistivity profile images (and timelapse videos) of the subsurface are included. Topographic surveys of all the sensors operated by the monitoring stations are included. In the vicinity of the two geophysical monitoring stations, longer and deeper electrical resistivity profiles were acquired. These allow one to image the boundary between the active layer (that freezes and thaws depending on ambient temperature) and underlying permanently frozen ground. Raw electrical resistivity data and corresponding reconstructed 2D electrical resistivity profile images of the subsurface are included (NET0105681_SUNSPEARS_PRIME 2D ERT data).
-

Extant euglenids from cultures LM and SEM images of living euglenids and euglenids post acetolysis Fossil material (recovered by standard palynological analysis) LM, SEM and TEM images of fossil materials from:- (i) The Torridonian of Scotland (ii) The Nonesuch Formation of Michigan, USA (iii) The 'fish beds' of the Silurian Inliers of the Midland Valley of Scotland.
-
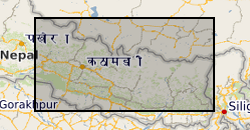
Raster (TIFF) file showing the simplified main bedrock geology units that comprise a ~45,000 km2 region of central-eastern Nepal.
-

Non -contact atomic force microscopy (NC-AFM) images of surface nanobubbles on the fluorcarbonate mineral synchysite. Synchysite is a rare earth fluorcarbonate mineral which has previously been relatively unstudied. Since nanobubbles were first imaged in 2000, they have been thought to play a intigral role in mineral processing. Images of nanobubbles were produced under collector reagent conditions favourable to flotation. These are the first images of nanobubbles on the fluorcarbonate mineral synchysite. Nanobubbles at the surface of synchysite improve the understanding of both flotation and nanobubble formation.
-
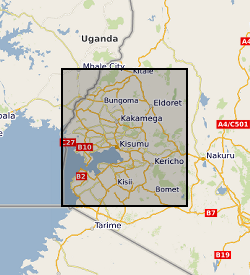
Soil prediction maps for 56 chemical elements, pH and organic matter content have been produced using machine learning analysis in western Kenya. The predictive maps were based on 452 soil samples collected across western Kenya during field surveys carried out between 2015 and 2020. Samples were analysed by the inorganic chemistry laboratories at the British Geological Survey. The maps, created using random forest machine learning algorithms, are displayed as raster files with a spatial resolution of 500m. The samples were collected as part of a geochemistry and health project to investigate the spatial incidences of diseases in the Rift Valley (e.g. oesophageal cancer, iodine/zinc deficiency), which included a range of data and sample collections to inform sources of micronutrients or exposure to potentially harmful elements, with outputs to inform agriculture and public health practitioners. These predictive maps provide a baseline geochemistry survey for the agri-community, academics and public health officials.