 NERC Data Catalogue Service
GeoPackage
Type of resources
Available actions
Topics
Keywords
Contact for the resource
Provided by
Formats
Representation types
Update frequencies
Scale
Resolution
-
The dataset presented provides average per-farm ecosystem service (ES) values for each NUTS3 region for Europe for the year 2019. The modelled ES are: carbon sequestration [t C ha-1 yr-1], food production (standard economic output) [euros yr-1], and nutrient (nitrogen) export [kg N yr-1]. The data is stored in vector files (GeoPackage). The per-farm ES values were modelled for five sub-country case studies and upscaled for each NUTS3 region where sufficient evidence supported a successful transfer and upscaling. Note that the criteria for upscaling the carbon sequestration were not met for any NUTS3 region and therefore the carbon sequestration is returned as NULL for each region. Full details about this dataset can be found at https://doi.org/10.5285/ae96d813-6468-421f-92c0-79f367cadbc3
-
The Land Cover Map 2024 (UK Land Cover Statistics) dataset summarises the coverage of different land cover types across Great Britain and Northern Ireland, classified into 21 UKCEH land cover classes, based upon Biodiversity Action Plan broad habitats. This data is provided in both .csv and geopackage (vector) formats. Statistics are calculated at country, county, and regional (England only) levels from the Land Cover Map 2024 (10 m classified pixels) datasets for Great Britain and Northern Ireland. A full description of this and all UKCEH LCM2024 products are available from the LCM2024 product documentation. In addition to UKCEH as copyright holders, the Land Cover Map 2024 (UK Land Cover Statistics) products use digital boundary products and reference maps. The source of the data is the Office for National Statistics and they are licensed under the Open Government Licence v.3.0. They contain OS data © Crown copyright and database right [2024]. Full details about this dataset can be found at https://doi.org/10.5285/0171ccb2-1c0c-404f-b782-e7204a86a92f
-
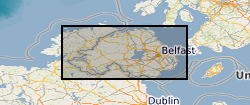
The 1:250k Geological Maps of Northern Ireland comprise the Superficial Deposits Map (Drift, 1991) and the Bedrock Map (Solid Geology, 1997). These maps identify landscape areas based on their lithology. The scale of the maps is 1:250 000 and provides a simplified interpretation of the geology that may be used as a guide at a regional level, but should not be relied on for local geology. Superficial deposits are younger geological deposits formed during the most recent geological time; the Quaternary. These deposits rest on older rocks or deposits referred to as bedrock. The superficial deposits theme defines landscape areas with a geological name and their deposit-type or lithological composition. The Superficial map shows the deposits within the extent of the six Counties of Northern Ireland. The Bedrock map comprises the bedrock geology and contains dykes and geological faults. Bedrock geology describes the main mass of solid rocks forming the earth's crust. Bedrock is present everywhere, whether exposed at surface in outcrops or concealed beneath superficial deposits or water bodies. Geological names are based on the lithostratigraphic or lithodemic hierarchy of the rocks. The lithostratigraphic scheme arranges rock bodies into units based on rock-type and geological time of formation. Where rock-types do not fit into the lithostratigraphic scheme, for example intrusive, deformed rocks subjected to heat and pressure resulting in new or changed rock types; then their classification is based on their rock-type or lithological composition. This assesses visible features such as texture, structure, mineralogy. Dykes defines small, narrow areas of a specific type of bedrock geology; that is igneous rocks which have been intruded into the landscape at a later date than the surrounding bedrock. Geological faults occur where a body of bedrock has been fractured and displaced by large scale processes affecting the earth's crust (tectonic forces). The Bedrock map shows the main bedrock geological divisions in Northern Ireland and coverage extends to the west into the Republic of Ireland. The printed map includes a stratigraphic column. Digital datasets have been derived from the maps and comprise three layers. 1. Superficial polygons, 2. Bedrock polygons and 3. Linear features. Attribute tables describe the polygon features. These data are generalised and superseded by the 1:10k Geological Maps of Northern Ireland.
-
Hydrological monitoring data for 55 years from 1967 to 2022 for the Coalburn catchment (1.5 km2). The catchment is located in Northern England within Kielder forest, Northumberland, and is the longest running forest research catchment in the UK. In 1972/73 the upland grassland was ploughed and planted with a conifer forest. The trees are now mature and around 30% of the catchment has been felled. From 1967 to 1993 a mixture of hourly and daily data is available and from 1993 onwards all the data is hourly. The data consist of precipitation, discharge, potential evapotranspiration, other meteorological data and snow depths. The data has been extensively quality controlled and can be used for hydrological modelling or data analysis to understand the effects of forests on river flows. Full details about this dataset can be found at https://doi.org/10.5285/88d72918-324e-42a8-a4f2-bbbc322814ff