 NERC Data Catalogue Service
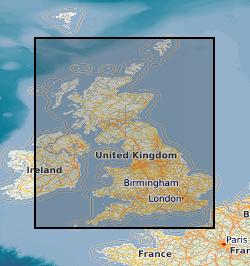
625000
Type of resources
Available actions
Topics
Keywords
Contact for the resource
Provided by
Years
Formats
Representation types
Update frequencies
Scale
-

The BGS database of geological maps is an index into BGS holdings of modern and historical published geological maps, geological standards and field slips, and also contains a range of other map series, including geophysical maps, geochemical maps, hydrogeological maps, thematic maps and other small-scale miscellaneous non-series maps. Historical vertical and horizontal sections, as well as indices to colours, are also included. The database comprises map metadata, including the title, theme, survey and revision years, publication years, mapped geological theme, base material, map function, colouration, approval status and the spatial extent of each map sheet. An accompanying file store contains high-resolution JPEG2000 scans for delivery, as well as various digital master and delivery formats. For a small number of maps, no scan exists. In total, the database contains over 240,000 scans of over 130,000 maps and field slips. The majority of the maps in the database cover Great Britain, but other regions are also represented, including a historical series of 1-inch maps of Ireland, 6-inch maps of the Isle of Man, 1:25 000 scale maps of the Channel Islands, and various overseas maps. The database contains a record of all geological maps produced by the British Geological Survey and its predecessors since the commencement of systematic geological mapping in the 1830s. The BGS Maps Database is mostly an archive of previous BGS maps, and is not the same as the latest BGS digital mapping. The maps within the database may differ significantly from BGS digital vector mapping. Further information about BGS digital vector mapping is available on the BGS website, under 'BGS Datasets'. The database has evolved over time, originally being a series of discrete databases. These databases have now been aggregated into a single dataset. BGS published maps, as well as 1:10 560 and 1:10 000 large-scale geological maps of England and Wales, and Scotland, are available through the BGS Maps Portal. Field slips and some thematic maps are not included on the BGS Maps Portal. The information about a map is normally a transcription from the map itself. Sometimes key information such as the title may not be actually printed on the map. Where this is the case the information is supplied in square brackets, e.g. [Kirk Maiden]. Information in square brackets means the information is supplied by the cataloguer and is not transcribed from the item.
-

A collection of small-scale non-series maps which offer whole-country coverage of the United Kingdom 1856-2013. Included in the collection are geological, tectonic, structural, mineral resource and geophysical maps, together with a small number of historical facsimile maps. Key geological maps included in the collection which ran to many editions are Geology of the British Islands 1:584 000 and the Geological Map of Great Britain 1:625 000. These maps are hard-copy paper records stored in the National Geoscience Data Centre (NGDC) and are delivered as digital scans through the BGS website.
-

Data identifying landscape areas (shown as polygons) attributed with geological names. The scale of the data is 1:625 000 providing a simplified interpretation of the geology and may be used as a guide at a regional or national level, but should not be relied on for local geology. Onshore coverage is provided for all of England, Wales, Scotland, the Isle of Man and Northern Ireland. Data are supplied as four themes: bedrock, superficial deposits, dykes and linear features (faults). Bedrock geology describes the main mass of solid rocks forming the earth's crust. Bedrock is present everywhere, whether exposed at surface in outcrops or concealed beneath superficial deposits or water bodies. Geological names are based on the lithostratigraphic or lithodemic hierarchy of the rocks. The lithostratigraphic scheme arranges rock bodies into units based on rock-type and geological time of formation. Where rock-types do not fit into the lithostratigraphic scheme, for example intrusive, deformed rocks subjected to heat and pressure resulting in new or changed rock types; then their classification is based on their rock-type or lithological composition. This assesses visible features such as texture, structure, mineralogy. Superficial deposits are younger geological deposits formed during the most recent geological time; the Quaternary. These deposits rest on older rocks or deposits referred to as bedrock. The superficial deposits theme defines landscape areas (shown as polygons) attributed with a geological name and their deposit-type or lithological composition. The dykes theme defines small, narrow areas (shown as polygons) of a specific type of bedrock geology; that is igneous rocks which have been intruded into the landscape at a later date than the surrounding bedrock. They are presented as an optional, separate theme in order to provide additional clarity of the bedrock theme. The bedrock and dykes themes are designed to be used together. Linear features data (shown as polylines) represents geological faults at the ground or bedrock surface (beneath superficial deposits). Geological faults occur where a body of bedrock has been fractured and displaced by large scale processes affecting the earth's crust (tectonic forces). The faults theme defines geological faults (shown as polylines) at the ground or bedrock surface (beneath superficial deposits). All four data themes are available in vector format (containing the geometry of each feature linked to a database record describing their attributes) as an OGC GeoPackage and are delivered free of charge under the terms of the Open Government Licence.
-

The data overlays superficial polygons on bedrock polygons giving a representation of the geology at the surface. Sourced from 1:50000 DiGMapGB-50 Version 6 where available, augmented by additional data from the following sources in the order - new 1:25000 mapping, new 1:35000 Superficial Derived Products interpretation, 1:250000 DiGMapGB-250 Bedrock or 1:625000 DiGMapGB-625 V4 Superficial. The attributes therefore include both superficial and bedrock plus their source. The geology is fitted to a relevant topographic base at the time of production. Full Great Britain coverage is available. The data is available in vector format. BGS licensing terms and conditions apply to external use of the data.
-

In 2011 the British Geological Survey (BGS) decided to begin the assembly of a National Geological Model (NGM) from its existing and on-going geological framework models , comprising integrated national crustal, bedrock and Quaternary models. The bedrock component is the most advanced of these themes and comprises both the calculated models and a complementary network of cross-sections that provide a fence diagram for the bedrock geology of Great Britain. This fence diagram, the GB3D_v2014 dataset is available in a variety of formats from the BGS website www.bgs.ac.uk as free downloads, it supercedes the earlier 2012 version. The model complements the existing 1:625 000 scale mapsheets published by BGS utilising the same colour schema and geological classification. The component cross-sections extend to depths between 1.5 and 6 km; they have an aggregate length of over 25,000 km, and they are snapped together at their intersections to ensure total consistency. The sections are based on the existing BGS geological framework models where they cut through them together and incorporate around 300 deep stratigraphic boreholes across England and Wales. The sections also take account of the vast wealth of published data on the subsurface structure of Britain both from BGS and in the scientific literature. Much of this is in the form of cross-sections, contour maps of surfaces, and thicknesses (isopachs). The fence diagram has been built in the Geological Surveying and Investigation in 3D (GSI3D) software. It is envisaged that this dataset will form a useful educational resource for geoscience students and the general public, and also provide the bedrock geology context and structure for regional and catchment scale studies. The fence diagram has been built in stages between 2009-14 using funding from the BGS National Capability Programme the Environment Agency of England and Wales, and the Nuclear Decommissioning Authority. Some 16 expert regional geologists compiled the sections.
-

An index to over 600 ground geophysical surveys carried out in the UK for a variety of projects. A large number of these surveys were done in conjunction with the DTI Mineral Reconnaissance Programme in the 1970's and 80's, and many others were carried out at the request of BGS field mapping groups. Information held describes the survey objective, location of measurements, geophysical methods and equipment used, reports and publications, storage locations of data and results (for analogue and digital data), dates and personnel. There are two datasets; one shows the outline of the survey areas, and the other shows the actual survey lines within each area.
-

Data identifying landscape areas (shown as polygons) attributed with geological names. The scale of the data is 1:625 000, providing a simplified interpretation of the geology which may be used as a guide at a regional or national level, but should not be relied on for local geology. Onshore coverage is provided for all of England, Wales, Scotland, the Isle of Man and Northern Ireland. The Dykes data defines small, narrow areas (shown as polygons) of a specific type of bedrock geology, igneous rocks which have been intruded into the landscape. The dykes are presented as an optional, separate theme in order to provide additional clarity of the Bedrock theme. The bedrock and dykes datasets are designed to be used together. The data are available in vector format (containing the geometry of each feature linked to a database record describing their attributes) as an OGC GeoPackage and are delivered free of charge under the terms of the Open Government Licence.
-

OneGeology is an international collaborative project in the field of geology supported by 113 countries, UNESCO and major global geoscience bodies. It aims to enable online access to dynamic digital geological map of the world for everyone. An EU Joint Research Centre project is using OneGeology geological data as a framework for the production of a Geogenic Radon Map of Europe. The BGS-HPA UK Onegeology Radon Potential dataset provides, within a 1:625,000 scale geological framework, a general indication of how the estimated arithmetic mean ground-floor radon concentration varies within the United Kingdom. The indoor radon data is used with the agreement of the Health Protection Agency (HPA). Mapping of radon-prone areas at the OneGeology 1:625 000 scale can be used to inform European policy makers, politicians and the general public about the general variation of radon potential within the United Kingdom at the European scale. The dataset should not be used at scales larger than 1:250,000 or for regulatory (i.e. Building Control or Radon Affected Area) purposes in the UK.
-
Data identifying linear features (shown as polylines) representing geological faults at the ground or bedrock surface (beneath superficial deposits). The scale of the data is 1:625 000 scale, providing a simplified interpretation of the linear features which may be used as a guide at a regional or national level, but should not be relied on for local geology. Onshore coverage is provided for all of England, Wales, Scotland, the Isle of Man and Northern Ireland. Geological faults occur where a body of bedrock has been fractured and displaced by large scale processes affecting the Earth's crust (tectonic forces). The digital data are attributed by fault type; two categories of fault are described in the data: fault at rockhead (representing normal dip-slip and strike-slip faults) and thrust fault (representing faults caused by compressive forces). The data have been generalised and show only the locations of major faults. The data are available in vector format (containing the geometry of each feature linked to a database record describing their attributes) as an OGC GeoPackage and are delivered free of charge under the terms of the Open Government Licence.
-

A collection of hydrogeological maps created by the British Geological Survey between 1967 and 1994. The maps in the collection cover aspects of groundwater availability, exploitation and quality, and were published at various scales from 1:25 000 to 1:625 000. A hydrogeological map is a specialized type of map that illustrates the distribution and characteristics of hydrogeological features in a particular area. Hydrogeological maps of the UK provide information on major aquifers, including geological and lithological information, surface drainage systems and water quality issues. The 23 maps show information on surface water features, the three dimensional geometry of aquifers, groundwater levels, abstractions and quality including saline intrusion in varying amounts of detail. They range in scale from 1:625 000, for the national map of the hydrogeology of England and Wales, down to 1:25 000 for some of the smaller regional maps. These maps are important tools for understanding and managing groundwater resources, as well as for addressing water-related environmental issues. These maps are hard-copy paper records stored in the National Geoscience Data Centre (NGDC), and are delivered as digital scans through the BGS website.