 NERC Data Catalogue Service
2002
Type of resources
Available actions
Topics
Keywords
Contact for the resource
Provided by
Years
Formats
Representation types
Update frequencies
Scale
Resolution
-

The BGS Geoscience Thesaurus contains approximately 6000 descriptor terms for concepts in the geoscience and related subjects. Some entries have scope notes to further explain the term. The original source of the data was the Australian Mineral Foundation thesaurus of geoscience; some terms have been added or updated to suit BGS needs and the content will continue to be updated as required. The thesaurus includes synonyms to descriptor terms, hierarchical relationships, symmetric (see also) relationships and lapsed (deprecated) term replacements.
-

The commercial GeoReports project, under the National Geoscience Information Service sector of the Information Systems and Management directorate, produces around 8000 GeoReports a year, giving an annual turnover of over 600,000 pounds currently. The site specific reports are aimed at anyone who is investigating ground conditions in Great Britain (geology, hydrogeology and any related geohazards, including radon). Georeports reference: http://www.bgs.ac.uk/georeports
-
A digital geochronological index to act as a domain constraint for geochronology columns in corporate data tables. It decodes geochronology codes, models pseudo parent-child relationships between intervals (for example, find the epochs within a given period), allows range searches (for example, find the epochs between lower limiting and upper limiting epochs) and provides radiometric ages with ranges of uncertainty. Follows the recommendations of the BGS Stratigraphy Committee. Phanerozoic after Gradstein and Ogg (1996), with the Ordovician scheme of Fortey et al. (1995); Proterozoic after Cowie and Bassett (1989); Archaean after an unpublished decision of the Precambrian Subcommission of the IUGS. Covers the whole of geological time. Geochronological resolution usually to age level. Lower resolution in the Archaean, Proterozoic, Cambrian. Greater resolution in the Caradoc Epoch.
-
Regional property grids of the Utsira Sand based on mapping from 2D regional seismic lines and geophysical logs. Grids include: Top Utsira depth, Base Utsira depth, Utsira isopach, Utsira porosity, Utsira porosity effective thickness, Utsira proportion clean sand. 2 km grid spacing. SACS/SACS2 EU project.
-
Derived from data collated from the 2005 Aggregate Minerals Survey, carried out by BGS for the Department for Communities and Local Government (CLG) which provide an in-depth and up-to-date understanding of regional and national sales, inter-regional flows, transportation, consumption and permitted reserves of primary aggregates for England and Wales. The information is used to monitor and develop policies for the supply of aggregates. This data set depicts the flow of crushed rock aggregate between the regions of England and Wales. The data originator also has similar data for sand and gravel and also the same data derived from the 1997 and 2001 Aggregate Minerals Surveys.
-
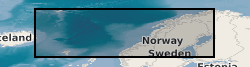
Longterm observations (2002-present) of atmospheric chemistry parameters have been made at the Weybourne Atmospheric Observatory (WAO) including ozone, carbon monoxide and dulphur dioxide, oxides of nitrogen and cloud condensation nuclei. WAO is an NCAS facility and part of the School of Environmental Sciences at the University of East Anglia (UEA). It is situated on the north Norfolk coast and is a world class facility for fundamental research, background atmospheric monitoring and teaching purposes. WAO operates a range of instruments in its measurement programme - the data from which is archived at the BADC. The WAO has also been the focus of many international experiments designed to into the chemistry of the planetary boundary layer and free troposphere.
-
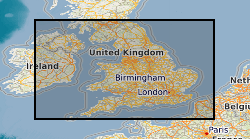
The University of Wales, Aberystwyth, 1290mhz mobile wind profiler - now referred to as the University of Manchester mobile wind profiler - was operated at the Mace Head Research Facility in County Galway, Ireland, as part of the North Atlantic Marine Boundary Layer EXperiment (NAMBLEX) field campaign in August 2002. During this period the mobile wind profiler obtained vertical profiles of the horizontal and vertical wind components. For each signal beam profiles of the signal to noise (SNR) ratio and spectral widths were also taken.
-
The International Satellite Cloud Climatology Project (ISCCP) was based at the Goddard Institute for Space Studies in New York. ISCCP was sponsored by the World Climate Research Programme for the purpose of "collecting and analysing satellite radiance measurements to infer the global distribution of cloud radiative properties and their diurnal and seasonal variations". This dataset contains the global monthly cloud analysis products (ISCCP-C2), at 250 km spatial resolution. They are derived from monthly averages of data taken with three-hour resolution. The products include monthly averages of calibrated radiances, cloud detection results, and cloud and surface properties from radiative analysis. There are 72 variables contained within the data set. The data available at the time of publication begin in July 1983 and extend through December 1990.
-
Global three-hourly cloud products as produced for the International Satellite Cloud Climatology Project (ISCCP) at the Goddard Institute for Space Studies in New York. The data on are the ISCCP Stage D2 data (ISCCP-D2), at 280 km spatial resolution. There are 202 variables contained within the dataset, which is at three-hourly temporal resolution. The data available at the time of publication of this dataset record in this archive have been obtained from the NASA Atmospheric Data Center (ASDC) and begin in July 1983 and extend to June 2006. A fuller dataset is available directly from ASDC - see link on this record. The data are from a number of radiometers deployed on NOAA, GOES (Geostationary Operational Environmental Satellite), METEOSAT, GMS and INSAT satellites operational during this period. This dataset is public. The data periods for the various satellite instruments used within this generation of this dataset are given below: Advanced Very High Resolution Radiometer (AVHRR) versions 1,2 and 3: - AVHRR on NOAA-7: 01/07/1983 to 31/01/1985 - AVHRR on NOAA-8: 01/10/1983 to 24/06/1984 - AVHRR on NOAA-9: 01/02/1985 to 08/11/1988 - AVHRR on NOAA-10: 17/11/1986 to 30/08/1991 - AVHRR on NOAA-11: 30/06/1997 to 18/10/1998 - AVHRR/2 on NOAA-12: 01/09/1991 to 31/12/1998 - AVHRR/2 on NOAA-14: 01/02/1995 to 30/09/2001 - AVHRR/3 on NOAA-15: 01/01/1999 to 31/07/2000 - AVHRR/3 on NOAA-16: 01/10/2001 to 30/06/2005 - AVHRR/3 on NOAA-17: 01/07/2002 to 30/06/2005 Very High Resolution Radiometer (VHRR): - VHRR data on INSAT-1 series (INSAT-1A to 1D): 01/04/1988 to 31/03/1989 GOES-Imager: - GOES-Imager data on GOES-10: 01/08/1998 to 30/06/2005 - GOES-Imager data on GOES-12: 01/04/2003 to 30/06/2005 Multispectral Imaging Radiometer (MIR): - MIR data on METEOSAT-2: 01/07/1983 to 11/08/1988 - MIR data on METEOSAT-3: 11/08/1988 to 25/01/1991 - MIR data on METEOSAT-4 : 19/06/1989 to 30/06/1991 METEOSAT Visible and IR Imager (MVIRI): - MVIRI data on METEOSAT-5: 01/02/1994 to 30/06/2005 - MVIRI data on METEOSAT-6: 01/03/1997 to 31/05/1998 Visible and Infrared Spin-Scan Radiometer (VISSR) data: - VISSR data on GMS-1: 21/01/1984 to 30/06/1984 - VISSR data on GMS-2: 01/07/1983 to 27/091984 - VISSR data on GMS-3: 27/09/1984 to 04/12/1989 - VISSR data on GMS-4: 04/12/1989 to 30/06/1991 - VISSR data on GMS-5: 01/06/1995 to 30/04/2003 - VISSR data on GOES-5: 01/07/1983 to 30/07/1984 - VISSR data on GOES-6: 01/07/1983 to 21/01/1989 - VISSR data on GOES-7: 26/04/1987 to 30/06/1991 - VISSR data on GOES-8: 01/05/1995 to 31/03/2003 - VISSR data on GOES-9: 01/01/1996 to 30/06/2005 For further information about the satellites and their instruments please see the linked documentation pages.
-
The composition of the air present over the Weybourne Atmospheric Observatory (WAO), situated on the north Norfolk coast, depends on its origins. Plots showing the footprints of 10 day back trajectories arriving at WAO have been calculated using the UK Met Office's NAME Lagrangian atmospheric dispersion model.