
British Geological Survey
Type of resources
Available actions
Topics
Keywords
Contact for the resource
Provided by
Years
Formats
Representation types
Update frequencies
status
Service types
Scale
Resolution
-

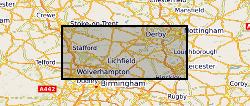
Magnetics Tellus Survey 2005 - 2006 Geophysical data were collected in 2005 and 2006 by the Joint Airborne-geoscience Capability (JAC), a joint venture between the Finnish Geological Survey (GTK) and the British Geological Survey (BGS). Magnetic, electromagnetic and terrestrial gamma-radiation (radiometric) data were recorded. Data were acquired for 80,458 line km of survey. Flight lines were spaced 200 m apart in the direction 165-345 degrees. The survey was flown with a nominal ground clearance of 56 m in rural areas and 240 m in urban areas, with sample intervals of 7 m (magnetics), 17.5 m (electromagnetics) and 70 m (gamma radiation).
-

The dataset uses the outline of the mining hazard not including coal in Great Britain data but has been re-attributed to reflect the potential affect of underground drainage. It excludes areas of Coal mining as these are covered by the Coal Authority and therefore are not included in this dataset. It has been reattributed from the A-E rating scale indicating the increasing likelihood of an underground mining hazard to a 1-4 scale identifying the likelihood of susceptibility to infiltration. The data was created using expert knowledge to reattribute the original mining area polygons.
-
The full title of this project is" Studies into metal speciation and bioavailability to assist risk assessment and remediation of brownfield sites in urban areas" and is funded by NERC under the URGENT thematic programme form 1998-2001. The project is being undertaken by a consortium of workers from the Imperial College, University of Nottingham, and the British Geological Survey. Innovative collaborative and multi-disciplinary research will be applied to the interpretation of urban geochemical maps and associated meta-datasets to assist decision making by local authorities in the redevelopment of brownfield sites. Source apportionment, speciation and bioavailability of potentially toxic heavy metals will be studied at representative conurbations in the UK Midlands region. Scanning electron microscopy, chemical extractions and soil solution and vegetable analysis, will be integrated with high precision isotopic analyses of Pb and other potential toxic metals in this study. The results will be available as maps in GIS format to provide a generic decision support system for quantitative health risk assessment.
-

Field reports and macroseismic questionnaires for recent British earthquakes. As of 2003, data collection for this dataset is mostly digital.
-

This dataset is part of the infiltration SuDS map and infiltration SuDS GeoReport. It has been developed to help inform planning decisions. This dataset shows the permeability of the bedrock for the purposes of determining whether the installation of infiltration sustainable drainage systems is possible. It differs from the permeability indices dataset in the following ways: a score field has been added to polygons, polygons of equal attributes have been merged, a short and detailed description and an advice and layer ID field has been added.
-

**Nothing Known About This**Grain size analysis and statistics of Jurassic-Cretaceous and Tertiary sands from East Dorset, the Hampshire Basin and Shaftesbury area. Analysis taken from selected sites therefore not complete cover of the area.
-

This dataset comprises the raster scans used as source information for capturing DiGMap 1:50000 scale data. The majority were processed under contract in India. Additions have been made. The images are georeferenced.
-

Contains the administrative and historical records of the Survey from 1835. The archive contains official files, correspondence, maps, photographs and many items dealing with the history of geology in general.
-
NIGL (NERC Isotope Geosciences Laboratories) is a comprehensive stable and radiogenic isotope laboratory facility that undertakes environmental, life, archaeological and earth science research, and educates and trains PhD students, in a collaborative research environment. This dataset contains a complete record of publications and scientific reports involving NIGL staff, dating from the formation of the group in 1987. The published research is not geographically restricted.
-

The data consists of an extended abstract submitted to 'The Fourth International Conference on Fault and Top Seals', Almeria, Spain, 20-24th September 2015. The abstract describes work carried-out on behalf of the 'Fault seal controls on CO2 storage capacity in aquifers' project funded by the UKCCS Research Centre, grant number UKCCSRC-C1-14. The CO2-rich St. Johns Dome reservoir in Arizona provides a useful analogue for leaking CO2 storage sites, and the abstract describes an analysis of the fault-seal behaviour at the site. http://earthdoc.eage.org/publication/publicationdetails/?publication=82673.