 NERC Data Catalogue Service
Surficial geology
Type of resources
Topics
Keywords
Contact for the resource
Provided by
Years
Formats
Representation types
Update frequencies
Scale
-
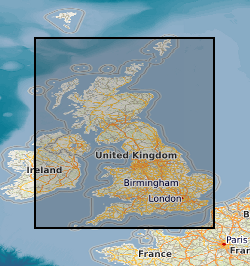
A series of tiled models of superficial thickness covering the UK. The models are derived by direct modelling (natural neighbour interpolation) of BGS Borehole records and BGS Digmap. For the purposes of modelling, superficial deposits include sediments deposited during the Quaternary, subsequent Holocene rivers and coastal systems and also modern anthropogenic material. i.e. deposits that are less than 2.6 million years old. Grids are overprinted with a minimum value so that areas where no bore data is present, but drift is known to occur are given a minimum 1.5m thickness. The superficial thickness models have been created as baseline datasets for the BGS Geohazard programme. They represent the first attempt by BGS to create nationwide models of such data and the models provide only a simple, mathematical interpretation of reality. The complexity of Superficial deposits in Great Britain is such that it is only possible to model indicative values of thickness and elevation. The models should never be used as a substitute for thorough site investigation.
-

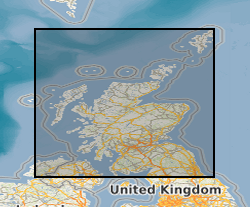
A superficial thickness model covering England Scotland and Wales. The model is derived by direct modelling (natural neighbour interpolation) of BGS Borehole records and BGS Digmap. For the purposes of modelling, superficial deposits include sediments deposited during the Quaternary, subsequent Holocene rivers and coastal systems and also modern anthropogenic material. i.e. deposits that are less than 2.6 million years old. Grids are overprinted with a minimum value so that areas where no bore data is present, but superficial deposits are known to occur are given a minimum 1.5m thickness. The superficial thickness model has been created as baseline datasets for the BGS Information Products programme. The model provides only a simple, mathematical interpretation of reality with some phantom points that improve the model mainly in valley areas where lack of data was given different results as those expected by a geological interpretation of the area. The complexity of Superficial deposits in Great Britain is such that it is only possible to model indicative values of thickness and elevation. The models should never be used as a substitute for thorough site investigation.
-

BGS LithoFrame models provide 3D geological characterisation for parts of the onshore and offshore UK at a range of scales. They present framework geological interpretation consistent with the stratigraphic framing schemes and scales used in BGS geological maps. Models have been constructed under a range of project activities and include local-scale superficial and bedrock models covering sites and focused study areas, medium-scale superficial and bedrock models covering many urban areas, transport corridors and smaller catchments, and regional-scale bedrock models covering large catchments, district areas, and geological basins. The 3D geological models have been constructed in a period between 2003 and 2018 and is managed by the 3D GeoModel project (National and International Geoscience).
-
The BGS Hydrogeological Maps of Scotland data product is comprised of three datasets: Bedrock Aquifer Productivity (Scotland); Superficial Aquifer Productivity (Scotland); and Groundwater Vulnerability (Scotland). Aquifer productivity is a measure of the potential of aquifers to sustain a borehole water supply. The Aquifer Productivity (Scotland) datasets indicate the location and productivity of bedrock and superficial aquifers across Scotland, and their groundwater flow characteristics. The Groundwater Vulnerability (Scotland) dataset shows the relative vulnerability of groundwater to contamination across Scotland. The BGS Hydrogeological Maps of Scotland data product is developed as a tool to support groundwater resource management. It may be useful to anyone interested in learning more about, assessing or managing groundwater resources across Scotland. The datasets within the product are delivered at 1: 100 000 scale.
-

3D geology models have been created for London, Glasgow, Cardiff and Liverpool. Users can create geological cross-sections, synthetic boreholes and horizontal slices through the 3D models. Underpinned by BGS geological data and expertise, the models and reports provide an enhanced understanding of the geological structures and sediments for urban practitioners to inform construction projects, infrastructure design, groundwater assessments and land use planning. These models cover depths from +300 m OD (Ordnance Datum) to -600 m OD. The models which cover Liverpool and London include superficial and bedrock units. The models which cover Glasgow and Cardiff include superficial units on an undifferentiated bedrock base model. The models were constructed in the National Geological Model and Urban Geoscience programmes between 2008-2016 in GSI3D and further refined in GOCAD for deployment to the web viewer. These datasets are managed by the 3D GeoModel project (National and International Geoscience).
-

The BGS Seabed Geology: Offshore East Anglia digital map provides detailed and accurate characterisation of the seabed geology, based on seabed and shallow-subsurface data. This dataset incorporates three complementary map components (Substrate Geology, Structural Geology, and Geomorphology), provided as discrete layers for viewing within a Geographic Information System (GIS). The bedrock geology of the mapped area comprises Cretaceous age Chalk Group sedimentary rocks. These rocks crop out extensively at seabed across the southern and central parts of the dataset forming an extensive bedrock platform and Europe’s largest known offshore chalk reef. This reef has been designated the Cromer Shoal Chalk Beds Marine Conservation Zone (MCZ) owing to the range of unique floral and faunal habitats that it supports. The Chalk Group is covered across the central (partly) and southern parts of the dataset by natural superficial deposits that accreted during the Quaternary. These include preglacial delta bottom-set (Westkapelle Ground Formation) and delta top-set (Yarmouth Roads Formation); and glacial sediments and landforms that were deposited and formed during at least two separate phases of glaciation that inundated parts of the southern North Sea and adjacent East Anglia during the Middle Pleistocene (Anglian / Elsterian) and Late Pleistocene (Late Devensian / Late Weichselian). Collective geological evidence includes extensive areas of out-cropping subglacial till; the presence of largely concealed and infilled over-deepened (>100 m deep) subglacial tunnel valleys, ice-marginal moraines, and a glacially disrupted chalk surface that includes the development of incised meltwater channels, detached and transported glacitectonic bedrock rafts and megablocks. Post-glacial environments from the Late-Pleistocene – Holocene (prior to marine inundation) included fluvial and estuarine deposition, that together with variable infill of late-glacial valleys are included within the Botney Cut Formation. Holocene marine transgression flooded the region, with shallow marine sedimentation active through modern times resulting in the variable cover of unconsolidated marine sediments, as well as the distribution of extensive current-induced bedforms, e.g., sediment banks, sediment waves and fields of mega ripples which are recorded within the Seabed Geomorphology dataset. Each theme is provided as distinct layers for viewing within a Geographic Information System (GIS). The “Substrate Geology” layer shows the distribution of bedrock and unlithified superficial deposits present at the seabed (below a thin veneer of seabed sediments, ‘one-metre principle’ described below) as a series of polygons; The “Structural Geology” layer represents the structural features observed at rockhead as a polylines layer, and “Geomorphology” theme consists of points, polylines, and polygons layers to portray the main seabed morphological and geomorphological features.
-
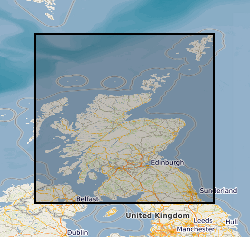
The Superficial Aquifer Productivity Scotland dataset forms part of the BGS Hydrogeological Maps of Scotland data product. This product is comprised of three datasets: Bedrock Aquifer Productivity Scotland; Superficial Aquifer Productivity Scotland; and Groundwater Vulnerability Scotland. Aquifer productivity is a measure of the potential of aquifers to sustain a borehole water supply. The Superficial Aquifer Productivity Scotland dataset version 2 (2015) indicates the location and productivity of superficial aquifers across Scotland, and their groundwater flow characteristics. Developed as a tool to support groundwater resource management, the dataset provides a guide to aquifer characteristics at a regional scale, and may be useful to anyone interested in learning more about, assessing or managing groundwater resources across Scotland. The dataset is delivered at 1: 100 000 scale; the resolution of the dataset being 50 m and the smallest detectable feature 100 m.
-

The UK Geoenergy Observatories (UKGEOS) Glasgow superficial deposits GSI3D model outputs, created by the British Geological Survey, provide a semi-regional overview of the depth, thickness and extent of glacial and post-glacial lithostratigraphic units above rockhead. The model allows users to visualise the likely subsurface sequence to be found beneath this part of Glasgow, applicable at a scale of around 1: 25,000 to 1: 10,000. The data is supplied as grids and shapefiles over a 7 by 4.15 km area, with the depth range to around 40 m below Ordnance Datum. This model describes an interpretation of the shallow geology before the UKGEOS Glasgow boreholes have been drilled, and was used to inform the expected sequence on drilling. Further details and model limitations can be found in the accompanying metadata report http://nora.nerc.ac.uk/id/eprint/524556
-
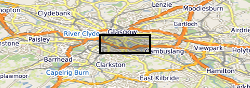
The UK Geoenergy Observatories (UKGEOS) Glasgow superficial deposits GSI3D model outputs, created by the British Geological Survey, provide a semi-regional overview of the depth, thickness and extent of glacial and post-glacial lithostratigraphic units above rockhead. The model allows users to visualise the likely subsurface sequence to be found beneath this part of Glasgow, applicable at a scale of around 1: 25,000 to 1: 10,000. The data is supplied as grids and shapefiles over a 7 by 4.15 km area, with the depth range to around 40 m below Ordnance Datum. This model describes an interpretation of the shallow geology updated to incorporate the results of drilling the 12 UKGEOS Glasgow boreholes (post-drill model). Further details and model limitations can be found in the accompanying metadata report http://nora.nerc.ac.uk/id/eprint/531155/ . DOI: https://doi.org/10.5285/915f690f-32cf-41b7-984e-c32344d3a543