
Soils
Type of resources
Available actions
Topics
Keywords
Contact for the resource
Provided by
Years
Formats
Representation types
Update frequencies
Service types
Scale
Resolution
-
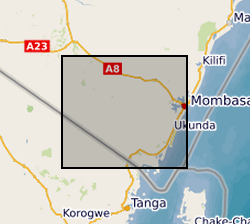
The data set contains Soil Data used in the Gro for GooD Project in Kwale, Kenya based on KENSOTER database and soil survey in study area. The KENSOTER dataset, specific for Kenya, was compiled by the Kenya Soil Survey (KSS) and ISRIC and released in 2006 where ISRIC plays a lead role in methodology development and programme implementation (http://www.isric.org/projects/soil-and-terrain-soter-database-programme). The dataset includes over 600 soil components, including synthetic profiles, which have been derived from soil survey reports and expert knowledge. The second version of the dataset which has been made available includes additional soil profile database and is also used for the assessment of soil carbon stocks. The gaps in the measured soil profile data have been filled using a step-wise procedure which includes three main stages: (1) collate additional measured soil analytical data where available; (2) fill gaps using expert knowledge and common sense; (3) fill the remaining gaps using a scheme of taxotransfer rules. Parameter estimates are presented by soil unit for fixed depth intervals of 0.2 m to 1 m depth for: organic carbon, total nitrogen, pH(H2O), CECsoil, CECclay, base saturation, effective CEC, aluminium saturation, CaCO3 content, gypsum content, exchangeable sodium percentage (ESP), electrical conductivity of saturated paste (ECe), bulk density, content of sand, silt and clay, content of coarse fragments, and available water capacity. The data have recently been used for the Green Water Credit (GWC) programme in the Upper Tana River Valley. This dataset was prepared for the Gro for GooD project by Mike Thomas, Rural Focus Ltd., Kenya; John Gathenya, JKUAT, Kenya. Gro for GooD: Groundwater Risk Management for Growth and Development
-

In August 2020, two natural slopes just outside Kuala Lumpur, Malaysia, were instrumented with sensors to measure soil suction and volumetric water content (VWC), and rainfall. At present, data has been collected at the two sites for approximately one year, although measurements are expected to continue for the foreseeable future. The measurements taken are aimed at providing guidance on the stability of soil slopes in response to changing climatic conditions. Data is currently being analysed by researchers at Durham University and the National University of Malaysia (UKM).
-

PROJECT DETAILS ONLY - NO DATA. PAH`s are recalcitrant, carcinogenic pollutants whose complex adsorption behaviour hampers both accurate quantification and strategies for bioremediation. Linking to a pre-existing URGENT funded initiative to assess and model of soil contaminant behaviour (GST/02/1991) this feasibility study will apply computational chemical approaches to model the adsorption/desorption of PAH on humic acid-covered mineral surfaces. The structural information on humic substances, as obtained from the GST/02/1991 study, will allow us to develop realistic computational models for PAH adsorption on humic/mineral systems. Information obtained from the simulations on these systems will be fed back in the GST/02/1991 study and may thus directly influence the development of bioremediation strategies.
-

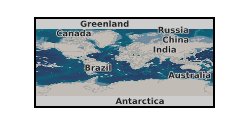
Data from laboratory experiments conducted as part of project NE/K011464/1 (associated with NE/K011626/1) Multiscale Impacts of Cyanobacterial Crusts on Landscape stability. Soils were collected from eastern Australia and transferred to a laboratory at Griffith University, Queensland for conduct of experiments. Soils were characterised before, during and after simulated rainfall to determine impact of rainfall on soil surface roughness and physical crusting. For two soils (#13 DL Clay_cyano; #14 DL sand_cyano) cyanobacterial crusts were grown on subsamples and these were used to compare the response of soils with, and without, cyanobacterial soil crusts to rainfall treatment. Rainfall intensity of 60 mm hr-1 was used and rainfall was applied for 2 minutes (achieving 2 mm application), 5 minutes (achieving 5 mm application), 2 minutes (achieving 2 mm application) at 24-hour intervals with soils dried at 35°C and 30% humidity between applications in a temperature/humidity-controlled room. Variables measured were soil texture, penetrometry, salinity, splash loss, infiltration, organic matter content, occurrence of ponding, three-dimensional topography. Details of rainfall simulator, growth of cyanobacteria (where soil #13 = Acbc, soil #14 = Bcbc) and all other methods can be found in Bullard et al. 2018, 2019. Bullard, J.E., Ockelford, A., Strong, C.L., Aubault, H. 2018. Impact of multi-day rainfall events onsurface roughness and physical crusting of very fine soils. Geoderma, 313, 181-192. doi: 10.1016/j.geoderma.2017.10.038. Bullard, J.E., Ockelford, A., Strong, C.L., Aubault, H. 2019. Effects of cyanobacterial soil crusts on surface roughness and splash erosion. Journal of Geophysical Research – Biogeosciences. doi: 10.1029/2018 tbc
-

Synthetic groundwater microcosm experiments inoculated with UKGEOS Glasgow soil microorganisms measuring the biodegradation of the biocide glutaraldehyde in the presence of salt, guar gum, and polyacrylamide. Samples and data are derived from the UK Geoenergy Observatories Programme funded by the UKRI Natural Environment Research Council and delivered by the British Geological Survey. NERC grant SHAPE-UK NE/R018006/1. Samples SSK111458, SSK111459. Core Sore Visit IDA number 271576.
-
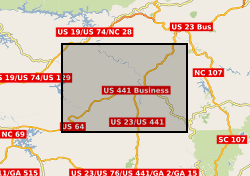
Supplementary material and link to published paper - Colluvium Supply in Humid Regions limits the Frequency of storm-triggered Landslides. DOI:10.1038/srep34438 Colluvium depth observations measured in the apexes of colluvial hollows in Macon County, North Carolina. Colluvium depths were measured using a soil tile probe (STD>0) and in pits excavated to bedrock (STD=0). Hollow axis gradient and hollow concavity were measured from a 6 m LiDAR derived DEM. Citation: PARKER, R. N., HALES, T. C., MUDD, S. M., GRIEVE, S. W. D. & CONSTANTINE, J. A. 2016. Colluvium supply in humid regions limits the frequency of storm-triggered landslides. Scientific Reports, 6, 34438.
-
Data from laboratory experiments conducted as part of project NE/K011464/1 (associated with NE/K011626/1) Multiscale Impacts of Cyanobacterial Crusts on Landscape stability. Soils were collected from two sites in eastern Australia and transferred to a laboratory at Griffith University, Queensland for conduct of experiments. Soils were A, a sandy loam, and B a loamy fine sand. Trays 120 mm x 1200 mm x 50 mm were filled with untreated soil that contained a natural population of biota. Soils were either used immediately for experiments (physical soil crust only: PC) or were placed in a greenhouse and spray irrigated until a cyanobacterial crust has grown from the natural biota. Growth was for a period of 5 days (SS), c.30 days (MS2) or c.60 days (MS1). Following the growing period (if applicable) trays were placed in a temperature/humidity controlled room at 35° and 30% humidity until soil moisture (measured 5 mm below the surface) was 5%. Trays were then subject to rainfall simulation. Rainfall intensity of 60 mm hr-1 was used and rainfall was applied for 2 minutes (achieving 2 mm application), 8 minutes (achieving 8 mm application) or 15 minutes (achieving 15 mm application). Following rainfall, trays were returned to the temperature/humidity-controlled room under UV lighting until soil moisture at 5 mm below the surface was 5%. A wind tunnel was then placed on top of each tray in turn and a sequential series of wind velocities (5, 7, 8.5, 10, 12 m s-1) applied each for one minute duration. On each tray the five wind velocities were run without saltation providing a cumulative dust flux. For the highest wind speed, an additional simulation run was conducted with the injection of saltation sands. Three replicates of each rainfall treatment were made. Variables measured include photographs, spectral reflectance, surface roughness, fluorescence, penetrometry, chlorophyll content, extracellular polysaccharide content, Carbon, Nitrogen and splash erosion and particle-size analysis (of wind eroded material). Details of rainfall simulator, growth of cyanobacteria, laser soil surface roughness characterisation and wind tunnel design and deployment in Strong et al., 2016; Bullard et al. 2018, 2019. Bullard, J.E., Ockelford, A., Strong, C.L., Aubault, H. 2018a. Impact of multi-day rainfall events on surface roughness and physical crusting of very fine soils. Geoderma, 313, 181-192. doi: 10.1016/j.geoderma.2017.10.038. Bullard, J.E., Ockelford, A., Strong, C.L., Aubault, H. 2018b. Effects of cyanobacterial soil crusts on surface roughness and splash erosion. Journal of Geophysical Research – Biogeosciences. doi: 10.1029/2018. Strong, C.S., Leys, J.F., Raupach, M.R., Bullard, J.E., Aubault, H.A., Butler, H.J., McTainsh, G.H. 2016. Development and testing of a micro wind tunnel for on-site wind erosion simulations. Environmental Fluid Mechanics, 16, 1065-1083.
-

PROJECT DETAILS ONLY - NO DATA. In process-controlled remediation of contaminated land the prospects for lasting success of a particular technique are often governed by the physicochemical properties and composition of the soil environment. Using a range of physical, chemical and biological techniques, this project will investigate these parameters and the key determinants at separate chromium- and polycyclic aromatic hydrocarbon-contaminated sites in central Scotland. The data will then be used to generate, for the specific types of sites and remedial approaches, customised linked chemical/physical transport models within which the influence of these parameters on site stability and remediative effectiveness can be tested. The latter will be further assessed via post-remedial screening of soil microbiological activity.
-

BGS soil property data layers including parent material, soil texture, group, grain size, thickness and European Soil Bureau description. These data are delivered under the terms of the Open Government Licence (http://www.nationalarchives.gov.uk/doc/open-government-licence/), subject to the following acknowledgement accompanying the reproduced BGS materials: Contains British Geological Survey materials copyright NERC [year]. Contact us if you create something new and innovative that could benefit others usingbgsdata@bgs.ac.uk.
-

Data from laboratory experiments conducted as part of project NE/K011464/1 (associated with NE/K011626/1) Multiscale Impacts of Cyanobacterial Crusts on Landscape stability. Soils were collected from two sites in eastern Australia and transferred to a laboratory at Griffith University, Queensland for conduct of experiments. Soils were A, a sandy loam, and B a loamy fine sand. Trays 120 mm x 1200 mm x 50 mm were filled with untreated soil that contained a natural population of biota. Soils were either used immediately for experiments (physical soil crust only: PC) or were placed in a greenhouse and spray irrigated until a cyanobacterial crust has grown from the natural biota. Growth was for a period of 5 days (SS), c.30 days (MS2) or c.60 days (MS1). Following the growing period (if applicable) trays were placed in a temperature/humidity controlled room at 35° and 30% humidity until soil moisture (measured 5 mm below the surface) was 5%. Trays were then subject to rainfall simulation. Rainfall intensity of 60 mm hr-1 was used and rainfall was applied for 2 minutes (achieving 2 mm application), 8 minutes (achieving 8 mm application) or 15 minutes (achieving 15 mm application). Following rainfall, trays were returned to the temperature/humidity-controlled room under UV lighting until soil moisture at 5 mm below the surface was 5%. A wind tunnel was then placed on top of each tray in turn and a sequential series of wind velocities (5, 7, 8.5, 10, 12 m s-1) applied each for one minute duration. On each tray the five wind velocities were run without saltation providing a cumulative dust flux. For the highest wind speed, an additional simulation run was conducted with the injection of saltation sands. Three replicates of each rainfall treatment were made. Variables measured include photographs, spectral reflectance, surface roughness, fluorescence, penetrometry, chlorophyll content, extracellular polysaccharide content, Carbon, Nitrogen and splash erosion and particle-size analysis (of wind eroded material). Details of rainfall simulator, growth of cyanobacteria, laser soil surface roughness characterisation and wind tunnel design and deployment in Strong et al., 2016; Bullard et al. 2018, 2019. Bullard, J.E., Ockelford, A., Strong, C.L., Aubault, H. 2018a. Impact of multi-day rainfall events on surface roughness and physical crusting of very fine soils. Geoderma, 313, 181-192. doi: 10.1016/j.geoderma.2017.10.038. Bullard, J.E., Ockelford, A., Strong, C.L., Aubault, H. 2018b. Effects of cyanobacterial soil crusts on surface roughness and splash erosion. Journal of Geophysical Research – Biogeosciences. doi: 10.1029/2018. Strong, C.S., Leys, J.F., Raupach, M.R., Bullard, J.E., Aubault, H.A., Butler, H.J., McTainsh, G.H. 2016. Development and testing of a micro wind tunnel for on-site wind erosion simulations. Environmental Fluid Mechanics, 16, 1065-1083.