Scottish SDI
Type of resources
Available actions
Topics
Keywords
Contact for the resource
Provided by
Years
Formats
Representation types
Update frequencies
Service types
Scale
-
The GeoSure data sets and reports from the British Geological Survey provide information about potential ground movement or subsidence in a helpful and user-friendly format. The reports can help inform planning decisions and indicate causes of subsidence. The methodology is based on BGS DiGMap (Digital Map) and expert knowledge of the behaviour of the formations so defined. This dataset provides an assessment of the potential for a geological deposit to compress under an applied load, a characteristic usually of superficial deposits such as peat or alluvium. Some types of ground may contain layers of very soft materials like clay or peat. These may compress if loaded by overlying structures, or if the groundwater level changes, potentially resulting in depression of the ground and disturbance of foundations. Complete Great Britain national coverage is available. The storage formats of the data are ESRI and MapInfo but other formats can be supplied.
-
This layer of the map based index (GeoIndex) shows areas covered by explanatory sheet Memoirs, along with basic information such as memoir title and publication date. The memoirs themselves,compiled by BGS geologists, date from the late 1890s to present day and provide a comprehensive and detailed account of all aspects of the geology of the areas covered by the 1:50,000 (and 1:63,360) map series. Some memoirs may cover more than one geological sheet area and a few cover key geological themes (eg Jurassic rocks) across a large region. Sheet Descriptions are fully colour-illustrated, shortened accounts of the geology that are available for some of the newer published geological sheets.
-
This layer of the map based index (GeoIndex) shows the availability of 1:63360 scale geological maps. The maps are available for most of England and Wales and show early geological mapping covering the OS Old Series one inch map sheet areas.
-

This INSPIRE network service provides an Atom feed of predefined datasets that are available for download.
-
This layer of the map based index (GeoIndex) shows the path the survey ship took whilst undertaking the ship gravity, magnetic and bathymetry survey. This index is based on data from approximately 350,000 line kilometres of multi-instrument geophysical survey lines. The data itself includes seismic, sonar, magnetic, gravity, echo sounder, multibeam bathymetry and navigation data, both in digital and analogue format. The data were primarily collected by BGS and the collection also includes additional third party data.
-
The GeoSure data sets and reports from the British Geological Survey provide information about potential ground movement or subsidence in a helpful and user-friendly format. The reports can help inform planning decisions and indicate causes of subsidence. The methodology is based on BGS DiGMap (Digital Map) and expert knowledge of the behaviour of the formations so defined. This dataset provides an assessment of slope instability. Landslide hazard occurs due to particular slope characteristics (such as geology, gradient, sources of water, drainage, man-made constructions) combining to cause the slope to become unstable. Downslope movement of materials, such as a landslide or rockfall may lead to a loss of support and damage to buildings. Complete Great Britain national coverage is available. The storage formats of the data are ESRI and MapInfo but other formats can be supplied.
-
The UK Onshore Geophysical Library was established in 1994 in conjunction with the Department of Trade and Industry (DTI) and the UK Onshore Operators Group (UKOOG). The Library manages the archive and official release of seismic data recorded over landward areas of the UK. By agreement with the DTI and HMSO, the Library operates as a registered charity, funded by revenues raised from data sales and donations, with the long term objective of bringing all available UK onshore digital seismic data into secure archival storage, whilst providing efficient access to all interested parties. BGS has access to the data at cost of copying only for science budget work. Data index on the BGS Geoscience Data Index.
-
BGS soil property data layers including parent material, soil texture, group, grain size, thickness and European Soil Bureau description. These data are delivered under the terms of the Open Government Licence (http://www.nationalarchives.gov.uk/doc/open-government-licence/), subject to the following acknowledgement accompanying the reproduced BGS materials: Contains British Geological Survey materials copyright NERC [year]. Contact us if you create something new and innovative that could benefit others usingbgsdata@bgs.ac.uk.
-
The map shows the localities of significant fossil samples, either collected by BGS Staff, or donated by individuals and institutions. The BGS fossil collections contain over 2 million specimens, including a sizeable quantity of type, figured and cited material. Since a small number of fossil locations are confidential, you are unable to view this dataset at large scales. However, if you send a data enquiry, such information may be made available. Enquiries are normally free, but a charge may be levied depending upon the time taken; users will be notified in advance. Material is available for inspection on application by e-mail. Specimens are sometimes available for loan to bona fide academics.
-
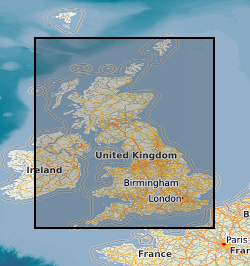
This layer of the map based index (GeoIndex) shows the location and name of active mineral workings in the UK and is derived from the BGS BritPits (British Pits) database. The BritPits database of onshore mineral workings in the UK is based on the records of the BGS, the Coal Authority, industry sources and the Valuation Office Agency (Minerals) and is maintained by the BGS Onshore Minerals and Energy Resources Programme. The database describes individual workings, both currently active and formerly worked, in terms of name, location (including Mineral Planning Authority), ownership, basic geology, commodity produced and end-uses. Contact details including the operator name, address, postcode and telephone and fax numbers are held where known. The location of over 6000 workings are held, with about 2000 currently being worked. The data can be produced digitally, under licence, in formats to meet customer requirements, such as locations of workings or operator addresses, and is suitable for use in GIS applications using the British National Grid. Although the GeoIndex is updated at regular intervals more information may be available than is shown at any one time.
 NERC Data Catalogue Service