 NERC Data Catalogue Service
Quaternary
Type of resources
Available actions
Topics
Keywords
Contact for the resource
Provided by
Years
Formats
Representation types
Update frequencies
Service types
Scale
Resolution
-

PROJECT DETAILS ONLY - NO DATA. The research will experimentally test the ice-segregation model of rock fracture in the context of near-surface bedrock. Experiments at the Caen Cold Laboratories will monitor the effects of different thermal regimes, moisture conditions and material properties on rock fracture, ice segregation and frost heave in large blocks of limestone and sandstone. Experimentally-formed fractures and segregated ice will be compared with predictions from two theoretical models of rock fracture and frost heave, and the observed rock fractures compared with contemporary and relict weathering profiles. By integrating curiosity-driven research on important Earth-surface processes (rock fracture, ice segregation) with their practical consequences (rock heave/settlement), the study will have international significance to cold-regions Earth science and engineering.
-
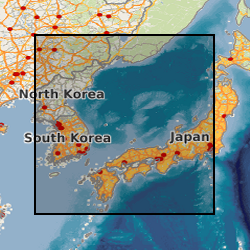
This award was made as a sailing participant of IODP Expedition 346, an international ocean drilling programme that NERC subscribe to. As such there was a lot of data generated that is owned and kept by IODP and which is freely available at: web.iodp.tamu.edu/UWQ/. Published Paper: Integrated Ocean Drilling Program Expedition 346 Scientific Prospectus - Asian Monsoon Onset and evolution of millennial-scale variability of Asian monsoon and its possible relation with Himalaya and Tibetan Plateau uplift. doi:10.2204/iodp.sp.346.2013
-
Quaternary QUEST was led by Dr Tim Lenton at UEA, with a team of 10 co-investigators at the Universities of Cambridge, Oxford, Reading, Leeds, Bristol, Southampton and at UEA. This dataset collection contains glacial and isotope model data. Over the last million years, the Earth has experienced a sequence of temperature oscillations between glacial and interglacial states, linked to variations in the Earth’s orbit around the sun. These climate oscillations were accompanied by changes in atmospheric CO2, but the fundamental reasons for this relationship are still unresolved. This project team aimed to compile a synthesis of palaeodata from sediments and ice cores, improve the synchronization of these records with each other, and use this greater understanding of the Earth’s ancient atmosphere to improve Earth system models simulating climate over very long timescales. A combined long-term data synthesis and modelling approach has helped to constrain some key mechanisms responsible for glacial-interglacial CO2 change, and Quaternary QUEST narrowed the field of ocean processes that could have caused glacial CO2 drawdown.
-
Quaternary QUEST was led by Dr Tim Lenton at UEA, with a team of 10 co-investigators at the Universities of Cambridge, Oxford, Reading, Leeds, Bristol, Southampton and at UEA. This dataset contains FAMOUS (FAst Met Office/UK Universities Simulator) glacial cycle model data from 150,000 years ago to present. The project team aimed to compile a synthesis of palaeodata from sediments and ice cores, improve the synchronization of these records with each other, and use this greater understanding of the Earth’s ancient atmosphere to improve Earth system models simulating climate over very long timescales. A combined long-term data synthesis and modelling approach has helped to constrain some key mechanisms responsible for glacial-interglacial CO2 change, and Quaternary QUEST have narrowed the field of ocean processes that could have caused glacial CO2 drawdown.
-
Quaternary QUEST was led by Dr Tim Lenton at UEA, with a team of 10 co-investigators at the Universities of Cambridge, Oxford, Reading, Leeds, Bristol, Southampton and at UEA. This dataset contains the Quaternary QUEST marine isotope data compilation for the last 150,000 years. The project team aimed to compile a synthesis of palaeodata from sediments and ice cores, improve the synchronization of these records with each other, and use this greater understanding of the Earth’s ancient atmosphere to improve Earth system models simulating climate over very long timescales. A combined long-term data synthesis and modelling approach has helped to constrain some key mechanisms responsible for glacial-interglacial CO2 change, and Quaternary QUEST have narrowed the field of ocean processes that could have caused glacial CO2 drawdown.
-
A superficial thickness model covering England Scotland and Wales. The model is derived by direct modelling (natural neighbour interpolation) of BGS Borehole records and BGS Digmap. For the purposes of modelling, superficial deposits include sediments deposited during the Quaternary, subsequent Holocene rivers and coastal systems and also modern anthropogenic material. i.e. deposits that are less than 2.6 million years old. Grids are overprinted with a minimum value so that areas where no bore data is present, but superficial deposits are known to occur are given a minimum 1.5m thickness. The superficial thickness model has been created as baseline datasets for the BGS Information Products programme. The model provides only a simple, mathematical interpretation of reality with some phantom points that improve the model mainly in valley areas where lack of data was given different results as those expected by a geological interpretation of the area. The complexity of Superficial deposits in Great Britain is such that it is only possible to model indicative values of thickness and elevation. The models should never be used as a substitute for thorough site investigation.
-

Digitally held Seabed Sediment, Facies, Bathymetry, Solid and Quaternary offshore geology for certain areas in the UK inshore waters. The storage formats of the data are ESRI and MapInfo but other formats can be supplied.
-
This layer of the Map based index (GeoIndex) shows the location of available UTM (Universal Transverse Mercator) series 1:250000 geological maps. These maps display Bedrock, Quaternary (Superficial deposits) geology of the offshore areas and Seabed Sediments of the UK landmass and offshore regions. The different versions are normally published as separate maps for land areas, but these may be combined on a single map for offshore areas. Maps are normally available in flat and folded format. The UTM Series (Universal Transverse Mercator projection) maps cover an area of 1deg. latitude by 2deg. longitude.
-
The Quaternary deposits thickness dataset is a digital geological map across the bulk of the UK Continental Shelf (UKCS), for areas up to a water depth of 200m, which shows the thickness of the deposits over bedrock in three categories: <5 m, 5 - 50 m, and >50 m Quaternary cover. These depth bands were picked because they represent the horizons that have impact on offshore infrastructure deployment. The map is derived from (unpublished) BGS 1:1000000 scale Quaternary digital geological mapping. The map was produced in 2014 in collaboration with, and co-funded by, The Crown Estate as part of a wider commissioned project to assess seabed geological constraints on engineering infrastructure across the UKCS. The data are held by the BGS as an ESRI Shapefile.
-

This Web service provides layers which are part of the BGS Superficial Deposits Thickness Model (SDTM) series of datasets. It currently includes two layers from the STDM 1 km hex grid dataset, which is available under the Open Government Licence. These two layers are symbolised on the mean and maximum values of the BSTM thickness model within the area of each hexagon. In these two layers, note that the data include a generic value of 1 m thickness for any area where superficial material is present, but is unproven by boreholes (shown on the map by a grey colour).