 NERC Data Catalogue Service
Petrophysics
Type of resources
Available actions
Topics
Keywords
Contact for the resource
Provided by
Years
Formats
Representation types
Update frequencies
-
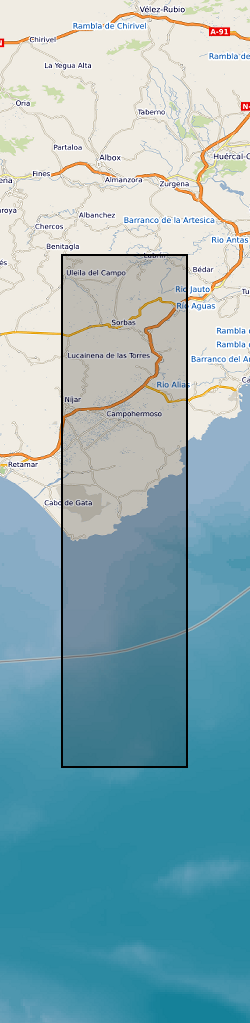
The dataset comprises: Petrophysical data for rocks from the region, XRD mineralogical data, Results of the gravity survey of the basin, tabulation and location of all bedding orientation data for the basin, and sediment transport lineation data. The dataset accompanies publication : On the Structure and Evolution of the Sorbas Basin, S.E. Spain, Tectonophysics 773 (2019) 228230, DOI: https://doi.org/10.1016/j.tecto.2019.228230
-
The data within this repository contains results from IODP-ICDP Expedition 364 which drilled the Peak Ring of the Chicxulub Crater, offshore Mexico. The offshore phase of this expedition occurred in April-May 2016, while the onshore phase occurred in October 2016. Further details of the IODP expedition can be found in the expedition report (https://doi.org/10.14379/iodp.proc.364.2017). The data within the repository is sorted into 4 separate folders: 1 - Optical_Images 2 - SEM_Image_Processing 3 - UStage 4 - Numerical_Models 1 - Optical_Images This folder contains two sub-folders: Optical_WholeSection, which contains whole thin-section plane- and cross-polarised stitched images of thin sections from Hole M0077A, acquired using a Zeiss optical microscope at 4x magnification at Curtin Univesity, Perth. Section names follow IODP standard sample naming convention. Optical_Photos, which contains sub-sub-folders delimiting samples, each of which contains individual images of features of interest in thin sections from Hole M0077A, magnification and a brief description of the feature are indicated by the file name and scale bars are provided on the image. 2 - SEM_Image_Processing This folder contains 10 sub-folders, specific to the individual analysed section. Each sub-folder contains a whole thin-section Back-Scattered Electron (BSE) Scanning Electron Microscope (SEM) stitched tiff image with a pixel width of 750nm. Data was acquired using a Zeiss Ultra Plus SEM at the NHM London. The images were then processed to analyse pore spaces within the thin sections. All folders contain a text file called “TOTAL.txt” which records data from every pore within the thin section. If the thin section contained any cataclasite bodies, two additional text files “CATACLASITE.txt” and “CATACLASITE_TOTALAREA.txt” can be found, the former contains the pore analysis of the selected cataclasite area, the latter indicates the size of the selected cataclasite area. All image analysis was carried out using the ImageJ software package. 3 - UStage This folder contains one .xlsx file that summarises the results of universal-stage optical microscope analysis of quartz planar deformation features of thin sections within hole M0077A. 4 - Numerical Models This folder contains 5 text files. “asteroid.inp” and “material.inp” are the input model parameters of the iSALE shock physics code (http://www.isale-code.de/redmine/projects/isale), these inputs were used to model the Chicxulub impact. Post-processing of the data was achieved using python to track the Stress-Strain-time paths of peak ring material, the remaining three .txt files contain the results of that analysis at different temporal resolutions.
-

These images were acquired using micro computed tomographic imaging of 7 sandstone plugs taken at various depths in the Sellafield borehole 13B. SF696 (63.8 m), SF697 (76.1 m), SF698 (96.98 m), SF699 (126.27 m), SF700 (144.03 m), SF701 (172.16 m) and SF702 (181.39 m). These samples are further detailed and analysed in the following article: http://dx.doi.org/10.1144/petgeo2020-092
-

Carbon dioxide (CO2) injection into deep saline aquifers is governed by a number of physico-chemical processes including mineral dissolution and precipitation, multiphase fluid flow, and capillary trapping. These processes can be coupled, however, the impact of fluid-rock reaction on the multiphase flow properties is difficult to study and is not simply correlated to variation in rock porosity. We observed the impact of rock mineral dissolution on multiphase flow properties in two carbonate rocks with distinct pore structures. The Ketton carbonate was an ooidal limestone with a distinct bimodal pore structure whereas the Estaillades limestone was a bioclastic limestone with a wide range of pore sizes. Observations of steady state N2-water relative permeability and residual trapping were obtained at 100 bars fluid pressure and 22°C, with X-ray tomography used to estimate fluid saturation. These tests alternated with steps in which mineral was uniformly dissolved into solution from the rock cores using an aqueous solution with a temperature controlled acid. Eight alternating sequences of dissolution and flow measurement were performed, with on average 0.5% of the mass of the rocks dissolved at each stage. A sequence of mercury injection capillary pressure measurements were conducted on a parallel set of samples undergoing the same treatment to characterize the evolving pore size distribution and corresponding capillary pressure characteristics. Variations in the multiphase flow properties were observed to correspond to the changes in the underlying pore structure. In the Ketton carbonate, dissolution resulted in an increase of the fraction of pore volume made up by the smallest pores and a corresponding increase in the fraction made up by the largest pores. This resulted in a systematic increase in the relative permeability to the nonwetting phase and decrease in relative permeability of the wetting phase. There was also a modest but systematic decrease in residual trapping. In the Estaillades carbonate, dissolution resulted in an increase in the fraction of pore volume made up by pores in the central range of the initial pore size distribution, and a corresponding decrease in the fraction made up by both the smallest and largest pores. This resulted in a decrease in the relative permeability to both the wetting and nonwetting fluid phases and no discernible impact on the residual trapping. In summary, the impact of rock matrix dissolution will be strongly dependent on the impact of that dissolution on the underlying pore structure of the rock. However, if the variation in pore structure can be observed or estimated with modelling, then it should be possible to estimate the impacts on multiphase flow properties.
-

These images were acquired using micro computed tomographic imaging of 4 sandstone plugs taken at various depths in the Glasgow UKGEOS borehole GGC01. GG496 (170.07 m), GG497 (168.66 m), GG498 (73.37 m) and GG499 (135.06 m). These samples are further detailed and analysed in the following article: http://dx.doi.org/10.1144/petgeo2020-092.
-

Supporting data for the paper 'Small-scale capillary heterogeneity linked to rapid plume migration during CO2 storage'. We supply experimental, analytical and numerical simulation data used in the paper. The supplied zipped folders follow the same order as the main paper, with codes to reproduce each figure (and those in the supporting information PDF). There are also video files (in the 5_Field_scale_simulation zipped folder) showing the final CO2 plume evolution from the static images in the main paper Figure 4. Descriptions of each of the folders are given below: 0 - README. This contains detailed instructions on the data and using the supplied files. 1 - Scaling analysis. This contains the scaling analysis analytical methods, with figure generation for Figure 1 in the main paper. 2 - Petrophysics. This contains all the petrophysical experimental data, analysis files and core flood simulation files. This is used to produce Figure 2 in the main paper. 3 - Fine_resolution_simulations. This contains the simulation files, Matlab post processing files and figure generation for the fine resolution simulations, presented in Figure 3 in the main paper. 4 - MIP_upscaling. This contains simulations files, Matlab post processing files and figure generation for the macroscopic invasion percolation scheme. The results of this are presented in the supporting information document. 5 - Field_scale_simulation. This contains the simulations files, Matlab post processing files and figure generation for the final field scale simulations in the main manuscript Figure 4 and in the supporting information. In each folder are separate READMEs containing specific information relevant for the included files.