
Natural hazards
Type of resources
Available actions
Topics
Keywords
Contact for the resource
Provided by
Years
Formats
Representation types
Update frequencies
Service types
Scale
Resolution
-

**No longer exists - now part of GeoSure**An assessment of the potential for a geological deposit to collapse under a critical load. A characteristic usually of loess or loessic material. The methodology is based on BGS digital stratigraphic linework and expert knowledge of the behaviour of the formations so defined.
-

**No longer exists - now part of GeoSure**An assessment of the potential for a geological deposit to show running sand behaviour under the action of flowing water. A characteristic usually of saturated sand and silt grade material. The methodology is based on BGS digital stratigraphic linework and expert knowledge of the behaviour of the formations so defined.
-

**No longer exists - now part of GeoSure**An assessment of the potential for a geological deposit to compress under an applied load. A characteristic usually of superficial deposits such as peat or alluvium. The methodology is based on BGS digital stratigraphic linework and expert knowledge of the behaviour of the formations so defined.
-

PROJECT DETAILS ONLY - NO DATA. The African continent is slowly splitting apart along the East African rift valley, a 3000 km-long series of deep basins and flanking mountain ranges. This process may eventually lead to the formation of a new ocean, but on a time scale of millions of years. In the remote Afar depression in northern Ethiopia, Earth's outermost shell, usually a relatively rigid, 150 km-thick plate, has been stretched, thinned and heated to the point of rupture, to the extent that a new ocean is about to form. Below the surface, upwelling rocks from Earth's mantle below are partially melting, rising, and cooling. Here, we have the unprecedented opportunity to witness the process of plate rupture and upwelling of molten rock (magma). Normally, this process occurs within shallow seas, or along the established seafloor spreading centres deep under the oceans; in Afar, though, we can actually walk across the region as it happens. Satellite observations of the earth show that tectonic plates move apart, on average, very slowly: usually at a few centimetres per year, or about the rate of fingernail growth. Very occasionally, however, sudden large movements occur, often with devastating consequences. In September 2005, a series of fissures opened along a 60 km section of the Afar depression, as the plate responded catastrophically to forces pulling it apart. Over about a week, the rift pulled apart by 8 metres, and dropped down by up to 1 metre. As told by local people, a series of earthquakes signalled the rise of molten rock to the surface on September 26, and ash darkened the air locally for 3 days. At the same time, satellites tracking the region showed that the surface above nearby volcanoes subsided by as much as 3 metres, as magma was injected along the fissure below the surface. The rapidity and immense length of rupture are not unexpected, but have never before been measured directly. The Afar depression is so hot and dry that almost no vegetation obscures the rocks exposed on its top surface; this also means that we can use satellites to image them and to measure the way that the Earth's surface changes as faults move, and as pressurised molten rock moves up and along the length of fissures within the rift valley. In the nine months since the first major earthquakes, more dramatic surface changes have continued to take place, and earthquakes continue to stir the earth. We are proposing a major set of experiments that will bring together experts on Earth deformation, and on magma sources, movement and eruption to this unique natural laboratory. Over the next five years, a team of UK, Ethiopian and US scientists will collaborate to find answers to fundamental questions of plate tectonics: . How do the different layers of the plate stretch apart? . Where does molten rock form and rise to form new oceanic crust? . How does the molten rock move up to the surface? Satellites will image the earth from above, and sensors will record sound waves from distant and near earthquakes and natural magnetic signals to image the thickness of the rock layers the plate comprises, and discover where the magma is located prior to eruption. We will also collect and analyse the composition of rocks from young volcanoes in the same region. The Earth history deduced from compositional variations in space and time will give us clues as to when and how often similar sorts of events happened in the past / and may happen again in the future.
-

This dataset provides an assessment of the potential for a geological deposit to show running sand behaviour under the action of flowing water, a characteristic usually of saturated sand and silt grade material. Complete Great Britain national coverage is available. The storage formats of the data are ESRI Shapefiles and MapInfo but other formats can be supplied. The GeoSure data sets and reports from the British Geological Survey provide information about potential ground movement or subsidence in a helpful and user-friendly format. The reports can help inform planning decisions and indicate causes of subsidence. The methodology is based on 'BGS Geology' (Digital Map) and expert knowledge of the behaviour of the formations so defined.
-

The GeoSure data sets and reports from the British Geological Survey provide information about potential ground movement or subsidence in a helpful and user-friendly format. The reports can help inform planning decisions and indicate causes of subsidence. Complete Great Britain national coverage is available. The Insurance Data give an index level assessment of the potential for a geological deposit to create financial insurance loss. The methodology is based on the 6 GeoSure individual hazard assessments. The storage formats of the data are ESRI and MapInfo but other formats can be supplied.
-
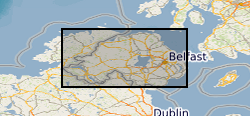
The joint PHE-GSNI-BGS digital Indicative Atlas of Radon in Northern Ireland presents an overview of the results of detailed mapping of radon potential, defined as the estimated percentage of homes in an area above the radon Action Level. The Indicative Atlas of Radon in Northern Ireland presents a simplified version of the Radon Potential Dataset for Northern Ireland, with each 1-km grid square being classed according to the highest radon potential found within it, so is indicative rather than definitive. The Radon Potential Dataset for Northern Ireland provides the current definitive map of radon Affected Areas in Northern Ireland. The Indicative Atlas of Radon in Northern Ireland is published in Z Daraktchieva, J D Appleton, D M Rees, K A M Adlam, A H Myers, S A Hodgson, N P McColl, G R Wasson and L J Peake, 2015. Indicative Atlas of Radon in Northern Ireland. PHE-CRCE-017, 22 pp. Radon is a natural radioactive gas, which enters buildings from the ground. Exposure to high concentrations increases the risk of lung cancer. Public Health England (PHE) recommends that radon levels should be reduced in homes where the annual average exceed 200 becquerels per cubic metre (200 Bq m-3), the radon Action Level. Public Health England defines radon Affected Areas as those with 1% chance or more of a house having a radon concentration exceeding the Action Level.
-
GeoSure Basic is a single, combined GeoSure model, based on the 6 geohazard layers produced for the GeoSure dataset package. The methodology behind GeoSure Basic uses only the highest score of all the GeoSure layers, which cover: Collapsible Deposits, Compessible Ground, Landslides, Running Sand, Shrink Swell, and Dissolution. The resulting model has been re-classified to show 'Negligible - Very Low', 'Low', and 'Moderate - High' potential for natural geohazards. Complete Great Britain national coverage is available.
-
The GeoSure data sets and reports from the British Geological Survey provide information about potential ground movement or subsidence in a helpful and user-friendly format. The reports can help inform planning decisions and indicate causes of subsidence. Complete Great Britain national coverage is available. GeoSure Basic is a single, combined GeoSure model, containing only the highest score of all the GeoSure layers. The model has been re-classified to negligible - very low, low and moderate - high. The methodology is based on the 6 GeoSure individual hazard Assessments. The storage formats of the data are ESRI and MapInfo but other formats can be supplied.
-
**This dataset has been superseded** The newGeoSure Insurance Product (newGIP) provides the potential insurance risk due to natural ground movement. It incorporates the combined effects of the 6 GeoSure hazards on (low-rise) buildings. This data is available as vector data, 25m gridded data or alternatively linked to a postcode database – the Derived Postcode Database. A series of GIS (Geographical Information System) maps show the most significant hazard areas. The ground movement, or subsidence, hazards included are landslides, shrink-swell clays, soluble rocks, running sands, compressible ground and collapsible deposits. The newGeoSure Insurance Product uses the individual GeoSure data layers and evaluates them using a series of processes including statistical analyses and expert elicitation techniques to create a derived product that can be used for insurance purposes such as identifying and estimating risk and susceptibility. The Derived Postcode Database (DPD) contains generalised information at a postcode level. The DPD is designed to provide a ‘summary’ value representing the combined effects of the GeoSure dataset across a postcode sector area. It is available as a GIS point dataset or a text (.txt) file format. The DPD contains a normalised hazard rating for each of the 6 GeoSure themes hazards (i.e. each GeoSure theme has been balanced against each other) and a combined unified hazard rating for each postcode in Great Britain. The combined hazard rating for each postcode is available as a standalone product. The Derived Postcode Database is available in a point data format or text file format. It is available in a range of GIS formats including ArcGIS (*.shp), ArcInfo Coverages and MapInfo (*.tab). More specialised formats may be available but may incur additional processing costs. The newGeoSure Insurance Product dataset has been created as vector data but is also available as a raster grid. This data is available in a range of GIS formats, including ArcGIS (*.shp), ArcInfo coverage’s and MapInfo (*.tab). More specialised formats may be available but may incur additional processing costs. Data for the newGIP is provided for national coverage across Great Britain. The newGeoSure Insurance Product dataset is produced for use at 1:50 000 scale providing 50 m ground resolution. This dataset has been specifically developed for the insurance of low-rise buildings. The GeoSure datasets have been developed to identify the potential hazard for low-rise buildings and those with shallow foundations of less than 2 m deep. The identification of ground instability and other geological hazards can assist regional planners; rapidly identifying areas with potential problems and aid local government offices in making development plans by helping to define land suited to different uses. Other users of these data may include developers, homeowners, solicitors, loss adjusters, the insurance industry, architects and surveyors. Version 7 released June 2015.